Health & Fitness
Prince William County, Manassas City & Manassas Park Real Estate Market Update August 2012
Prince William County, Manassas City & Manassas Park Real Estate Market Update August 2012


Prince William County, Manassas City & Manassas Park Real Estate Market Update August 2012
As of September 17, 2012 there are 1,050 homes for sale in Prince William County, 83 homes for sale in Manassas City and 25 in Manassas Park for a total of 1,158 homes for sale. This is down from the 1,214 homes for sale last month.
Of the 1,158 homes for sale 123 are marked as potential short sale and 53 are bank owned or foreclosures. Both short sale and foreclosure are down again this month. This is great news for traditional sellers who are no upside down as well as property values for the area.
Find out what's happening in Manassasfor free with the latest updates from Patch.
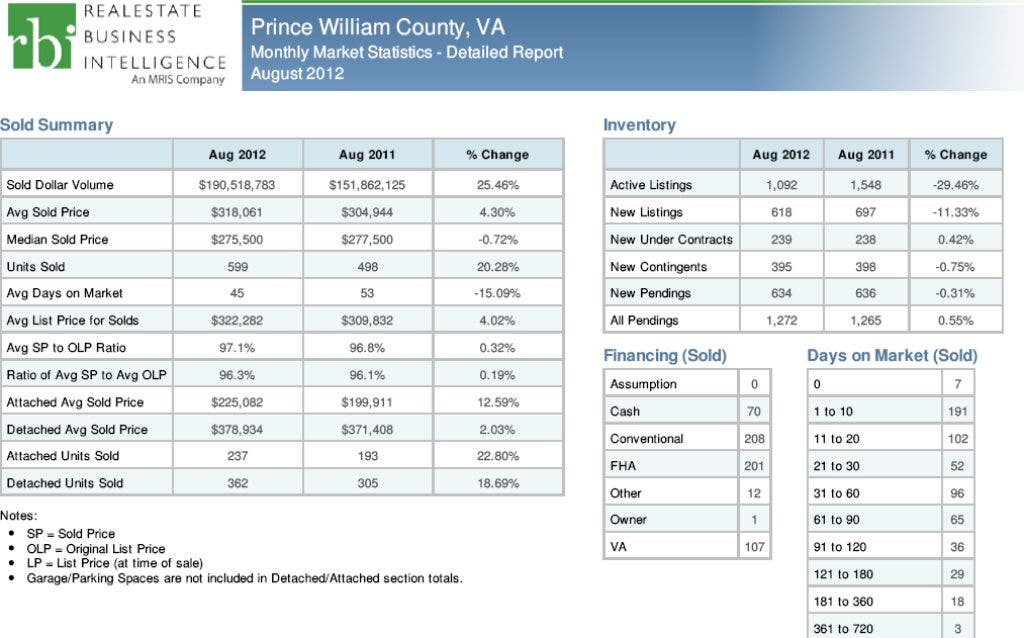
As the inventory dwindles the days on the market for properly priced homes become fewer and fewer. While the days on the market average out for Prince William County as 45 days if you look at the graph you can see the majority is under 30 days. In the month of August 695 home went to settlement, leaving a two month inventory. Of the 695 homes that settled 113 were short sales, 71 were banked owned or foreclosure and the remaining 695 were new construction or traditional sellers.
Year over year Manassas Park has seen a 25.91% increase in the average sold price, Manassas seen a 10.95% increase and Prince William County seen a 4.30% increase. This is due to fewer distressed properties and a shortage of inventory that has pushed prices up.
Find out what's happening in Manassasfor free with the latest updates from Patch.
The graph's break out the real estate market update for August 2012 for Prince William County, Manassas City and Manassas Park. This will give you a snap shot of how many homes sold in the month of August. This information may not be reflective of homes in your specific neighborhood, as that would require a more detailed report. The graph's are provided by RBI ( Real Estate Business Intelligence).