


This week we’ve been looking at the final 5 maps being considered for the district elections for Lake Forest in 2018. On Nov 7 the Council meets to select the final map.
To date we analyzed the maps according to whether
- · they maintained the “one person one vote” federal mandate” (Click Here)
- · they kept communities of interest intact (Click Here)
In these comparisons (“one person one vote” and “communities of interest”), where the data are well established, Map #109 did the best job by far and Map #115 did the worst job. Maps #110 did the second best job and Maps #128 and #116 had intermediate values.
Find out what's happening in Lake Forestfor free with the latest updates from Patch.
Our final way to look at the maps is with regard to “compactness”. Compactness is a desirable quality for a number of reasons. It allows everyone to get a sense of the area. For meetings, it makes it easy for everyone to come to a central place. It makes it easier to get a sense of priorities since the geographic area is more delineated. For the Council member it makes it easier to communicate, go door to door, hold meetings, etc.
The software used by the demographers has a “compactness” score called “Reock” which is “an area-based measure that compares each district to a circle, which is considered to be the most compact shape possible.” Using this measure, the higher the score, the more the compactness. Here are the results:
Find out what's happening in Lake Forestfor free with the latest updates from Patch.
- · Map #110 - .50
- · Map #109 - .40
- · Map #116 - .40
- · Map #115 - .35
- · Map #128 - .20
It’s easy to see that the worst map by far is Map #128 which has a series of 4 long fingers, combining people from Portola Hills with people from as far away as El Toro Park, a distance of nearly 7 miles. Similarly, people in Foothill Ranch are combined with people in Lake 1, a distance of more than 7 miles.
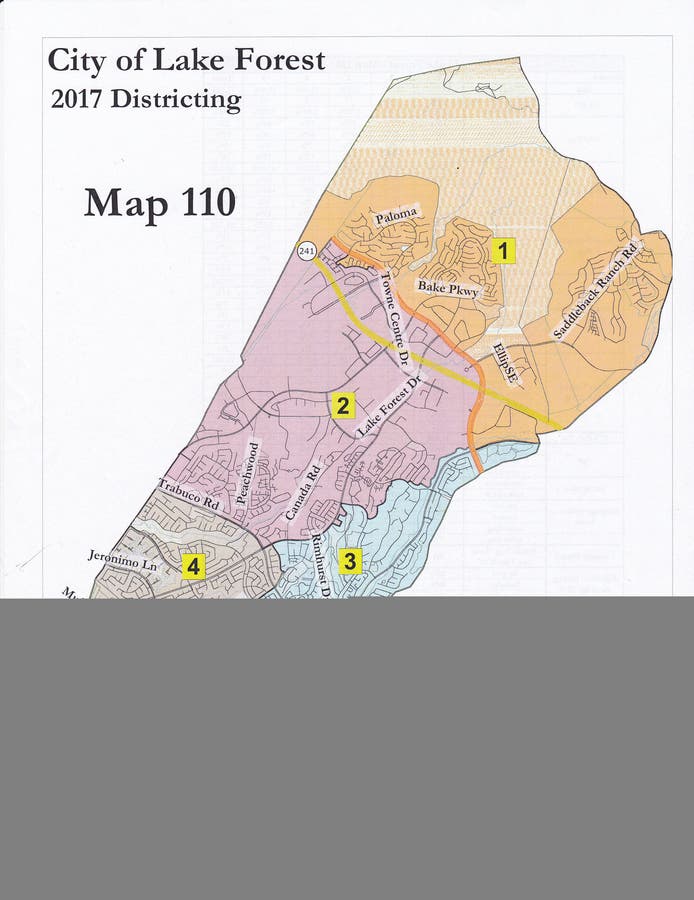
It’s less easy to see why Map #110 is better than Maps #109 and #116.
Map #110 has only one district with a strange shape – district 3, that runs from the border with Mission Viejo and on this south side has a total distance of 3 miles.
Map #109 has one long thin district that stretches as much as 5 miles, along the south side of the City.
Map #115 has one district that focuses on Foothill Ranch but then stretches down as far as Trabuco Rd, a distance of over 5 miles. The district in Portola Hills stretches down to Creekside, a distance of 6+ miles.
Tomorrow we’ll summarize.
ABOUT THE AUTHOR
Dr. Jim Gardner is on the City Council for Lake Forest. You can check him out on LinkedIn and/or Facebook and you can share your thoughts about the City at Lake Forest Town Square on Facebook. His comments are not meant to reflect official City Policy.
Dr. Gardner has office hours every Tuesday from 4 pm to 6 pm at the City Hall. In addition, he holds a mini town meeting every quarter. The next meeting will be on Dec 2 at 2 pm at the El Toro Public Library.