We keep hearing that our teachers are paid less than our peer communities. A review of teacher contracts for our peers (the Middlesex League) as defined by our Superintendent shows our salaries are in line with our peers. Let’s first look at whether or not the Middlesex League is the correct peer group. Below is a chart of the Middlesex League towns with population and median income. As you notice, five (5) of the twelve (12) towns have median incomes that far exceed Melrose and would not be a meaningful comparison.
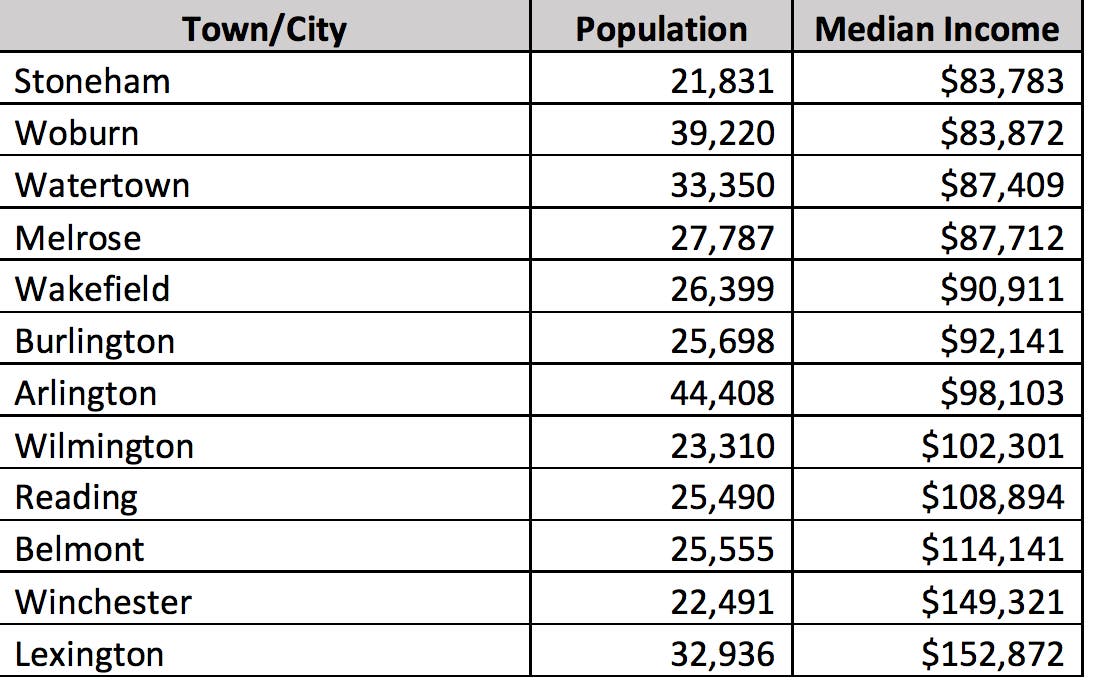
Data taken from Cleargov.com
Of the Middlesex League the following teacher pay scales were available online via teacher contracts. These charts compare teacher’s pay levels at the Master’s level with five (5) years of experience and Master’s level with ten (10) years of service.
Find out what's happening in Melrosefor free with the latest updates from Patch.
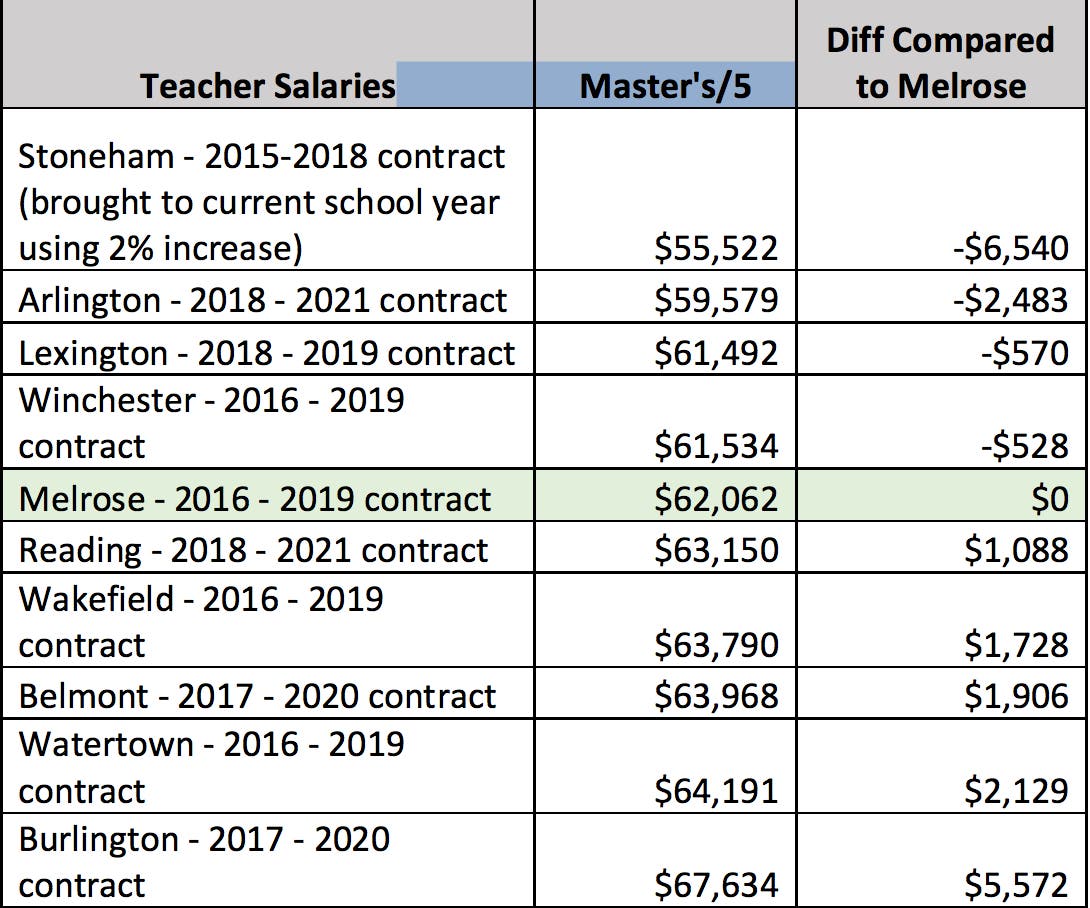
*Woburn and Wilmington contracts not available online
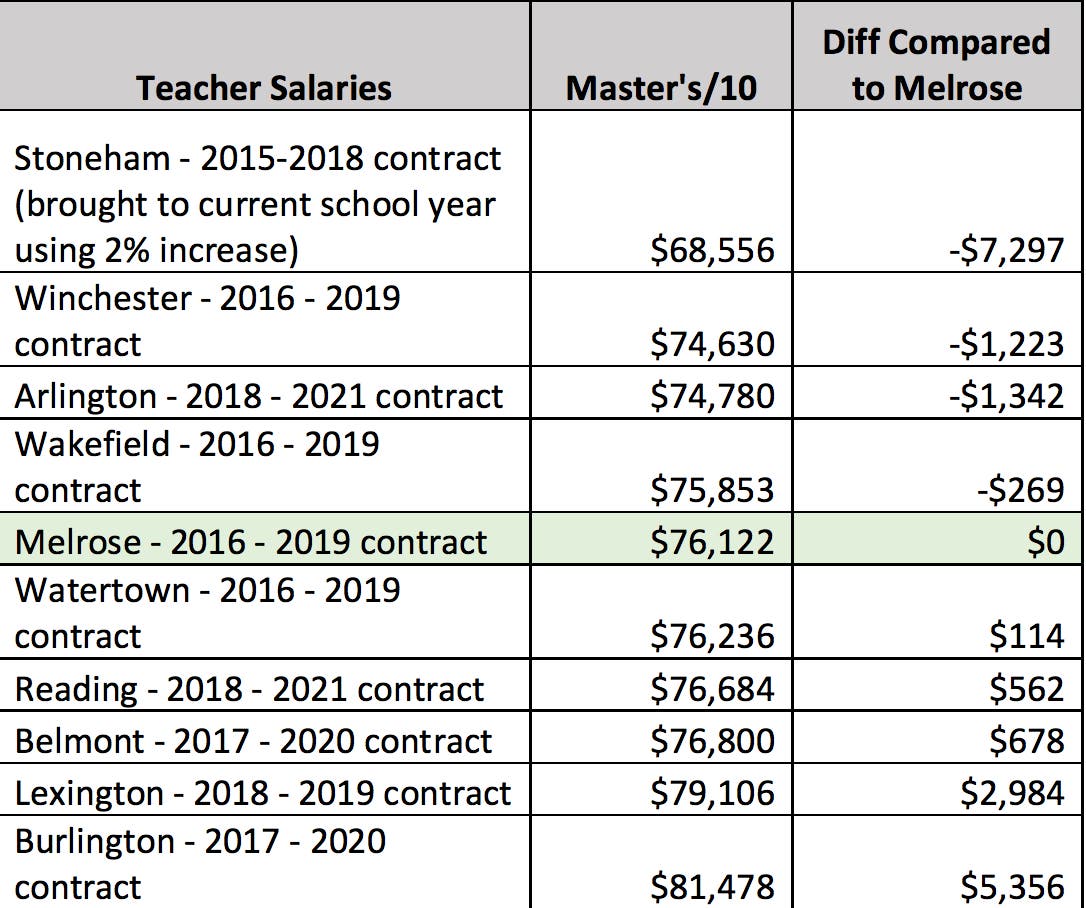
What’s clear from these charts is that Melrose teacher pay is comparable within a few thousand dollars of any of the peer districts. It should be noted that Winchester whose median income far exceeds Melrose falls below Melrose at both the five (5) year and ten (10) year mark. When we’re told a teacher left Melrose to go someplace and make $20,000 more, the question is where did they go?
Find out what's happening in Melrosefor free with the latest updates from Patch.
When total salary is looked at without understanding where teachers fall within the steps and lanes the data is misleading. In order to truly compare salaries, we must understand where each teacher sits within the steps and lanes. If our teachers are less experienced and therefore on the lower steps the result is what appears to be lower salaries.
For example, Melrose has three (3) teachers at Masters step 5 ($62,062 x 3 teachers = $186,186) and Reading has three (3) teachers but they are at Masters step 10 ($76,684 x 3 teachers = $230,052). Taken just in total dollars it appears that Melrose teacher salaries are far below Reading but in actuality that is untrue as it is only because the Reading teachers are further along in the steps.
Lastly, there are other factors that go into teacher salary such as the cost of health insurance. Melrose pays 84% of the total cost of health insurance. As an example of how this works, the Tufts Health Plan Navigator total monthly premium for an individual is $743.44 with Melrose paying $624.49 and employee paying $118.95 (data from City of Melrose FY19 rates found on City webpage). Annually this results in $7,493.88 being paid by Melrose and $1,427.40 paid by the employee. Family coverage total monthly premium is $1,811.88 with Melrose paying $1,521.97 and the employee paying $289.90. The annual cost is Melrose pays $18,263.70 and the employee pays $3,478.80. These are extraordinary numbers. Here are the percentages paid by some of our peers:
Stoneham – 80%
Reading – 71%
Winchester – 75%
Wakefield – 75%/80% depending on plan selected
Lexington – 82%
Burlington – 70%
Belmont – 80%
Watertown – not available
As you can see, all are below Melrose and if we were to look at the average for this group it is 76%. If Melrose were to drop to a 76% contribution, it would result in the individual cost to Melrose dropping from $624.49/month to $565.01/month or from $7,493.88/year to $6,780.17/year, a savings of $713.71 per year per enrolled employee. For family it is a total savings of $1,739.35 per year per employee enrolled. If we assumed 100 employees enrolled in this particular plan with 75 in individual and 25 in family the total savings to Melrose is $97,012 ($713.71 x 75 = $53,528.25 + $1,739.35 x 25 = $43,483.75)!
So what’s the answer to are our teachers really paid less? The answer is no!
Melrose Taxpayers’ Alliance