Health & Fitness
Big Debtor States Like Obama
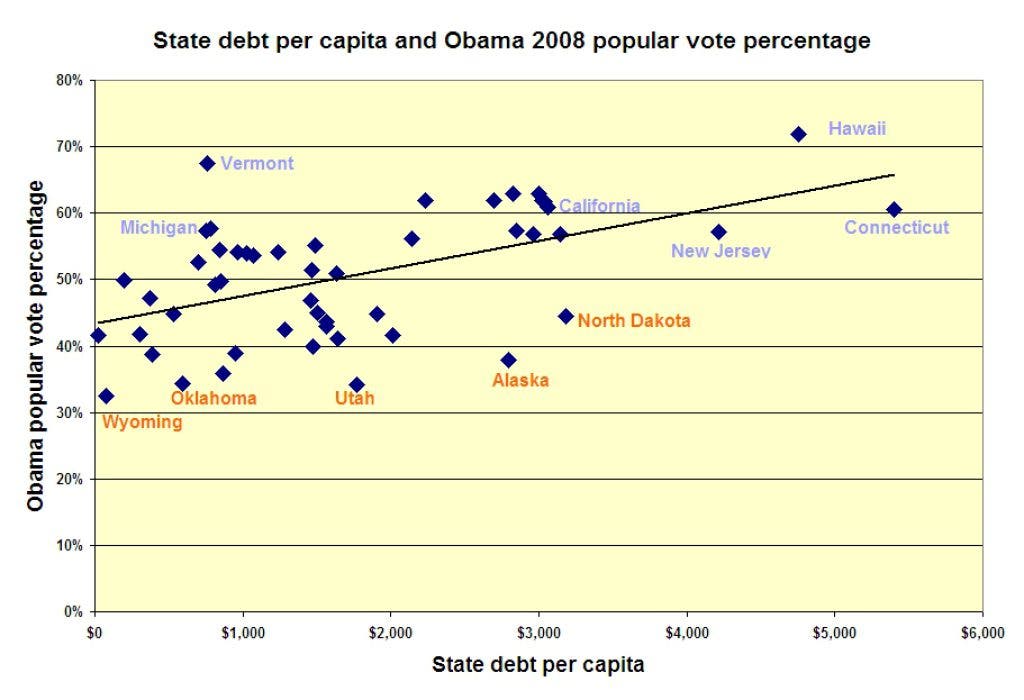
The higher a state's debt per capita, the more likely it was to go for Obama in the 2008 election. The relationship is very clear and highly significant statistically.
State Budget Solutions' (SBS) second annual state deficit report, released October 24, revealed aggregate state debt (all states, not just Michigan) currently exceeds $4 trillion. The media has already beaten the trivial parts of the report to death. Yes, California has the largest total debt, but it also has 37 million people, so big deal. The data gets more interesting when you look at debt per capita, which ranges from $21 per capita in Nebraska, to $750 per capita in Michigan, to a whopping $5,402 per capita in Connecticut. Put differently, Connecticut's per capita debt is 257 times Nebraska's. Yikes. Stupid Nutmeggers.
But what really pokes you in the eye is that the higher a state's debt per capita, the more likely it was to go for Obama in the 2008 election. The relationship is very clear, as appended graph and data table show. I'll leave readers to draw their own conclusions from this. An ordinary least squares regression of Obama popular vote percentage on state debt per capita has an R-square of .28 and a significance of .00007. Medical researchers think something significant at the .05 level is worth gloating over (it's traditional, but really a completely arbitrary cutoff), and this regression is 700 times more significant than that.
Not much point in regurgitating the details of the SBS report, which you can read for yourself.
Find out what's happening in Oakland Township-Lake Orionfor free with the latest updates from Patch.
The good news for Michigan is that while it currently ranks 50th in economic performance, it ranks 25th in economic outlook. When you're down, you're down, and there's nowhere to go but up. (Unless you happen to be California.)
Data in the graph and table below are based on the SBS data mentioned above and 2008 election results.