Community Corner
How Much Have Englewood And Englewood Cliff's Populations Changed Since 1980?
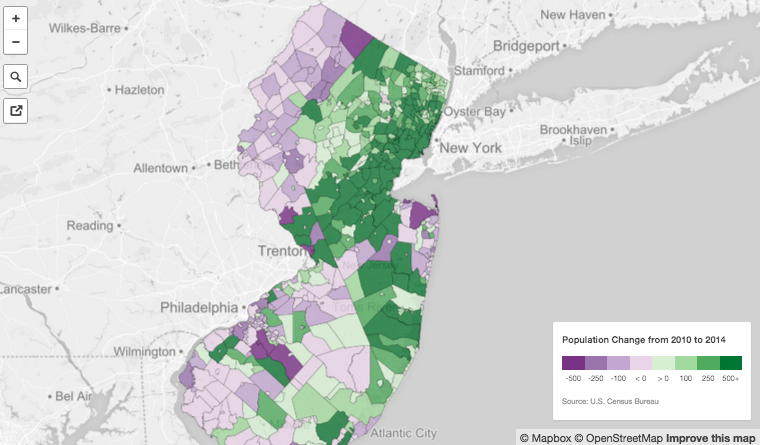
Interactive map shows how much every New Jersey municipality's population has changed in 35 years.

Englewood’s population has increased by nearly 4,000 people since 1980 information from the U.S. Census Bureau shows.
Englewood’s population was 23,701 in 1980 and 27,147 in 2010. Last year it was estimated to be 27,670.
Englewood Cliff’s population has remained virtually unchanged in 35 years. In 1980 it was 5,698 and 5,281 in 2010. Last year it was estimated to be 5,385.
Find out what's happening in Englewood-Englewood Cliffsfor free with the latest updates from Patch.
Newly-released statistics from the U.S. Census Bureau Current Population Estimates, a survey that tracks basic population figures between Censuses, provides a breakdown of how every municipality’s population has changed.
Jersey City, Elizabeth, Monroe (in Middlesex County), Franklin (in Somerset County), and Newark grew the fastest since 2010. All four of those municipalities population’s grew since 1980, with Monroe’s increasing by 170 percent. Newark’s population has actually decreased 15 percent since 1980.
Find out what's happening in Englewood-Englewood Cliffsfor free with the latest updates from Patch.
Approximately 187 municipalities lost population from 2010 to 2014, NJ.com reported, while 387 grew.
Much of the growth has been concentrated in the communities closest to New York City in Bergen, Passaic, and Essex counties, and along the Jersey Shore in Ocean County.
Many communities in the northeastern and southeastern parts of the state in Sussex, Warren, Hunterdon, Salem, and Cumberland counties have seen their populations decrease.
How much did your municipality’s population change? Tap or hover on your town on the interactive map to find out.
Get more local news delivered straight to your inbox. Sign up for free Patch newsletters and alerts.