Politics & Government
2026 Unofficial Election Results: Nassau County Legislature
See how voters cast their ballots for legislators, including Walker Vs. Johnson and Mullaney Vs. Pentola.

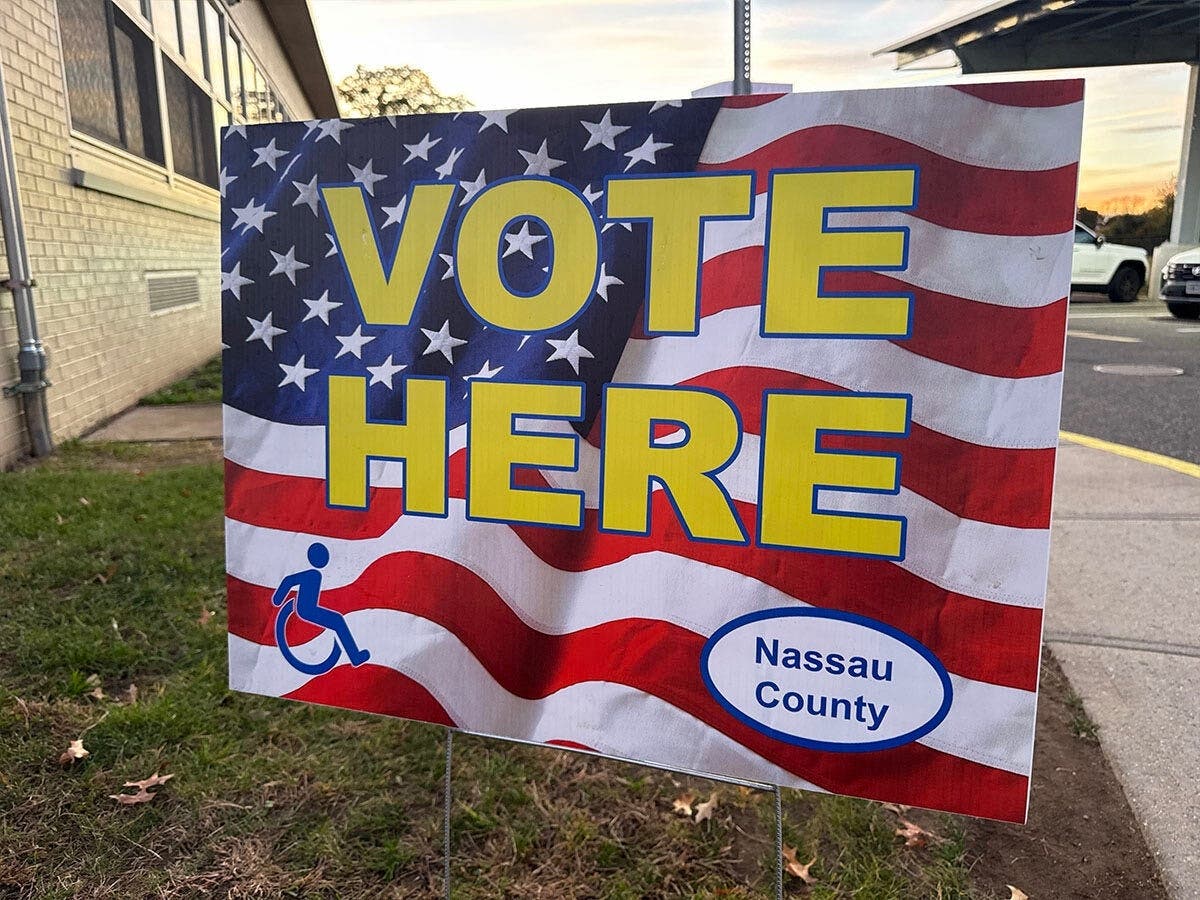
NASSAU COUNTY, NY — Nassau County residents cast their votes, and this year's unofficial results are in.
Below are the 2026 unofficial results for the Nassau County Legislature, as of Wednesday morning, reported by the Nassau County Board of Elections.
The names in bold are the candidates poised to be declared winners. The results have not been officially called yet, and there are still 41 districts left to report.
Find out what's happening in Long Islandfor free with the latest updates from Patch.
County Legislator, 1st District
Scott M. Davis (Democrat) — 18,084 votes | 71.34 percent
Find out what's happening in Long Islandfor free with the latest updates from Patch.
Edward J. Lino (Republican, Conservative) — 7,251 votes | 28.60 percent
County Legislator, 2nd District
Viviana L. Russell (Democrat) — 12,681 votes | 72.19 percent
Lamont E. Johnson (Republican, Conservative) — 4,875 votes | 27.75 percent
County Legislator, 3rd District
Carrié Solages (Democrat, Working Families) — 17,835 votes | 72.95 percent
Kadeem M. Brown (Republican, Conservative) — 6,592 votes | 26.96 percent
County Legislator, 4th District
Michael J. Pentola (Democrat) — 12,849 votes | 44.95 percent
Patrick Mullaney (Republican, Conservative) — 15,721 votes | 55 percent
County Legislator, 5th District
Olena Nicks (Democrat) — 12,481 votes | 68.03 percent
Moshe E. Hill (Republican, Conservative) — 5,855 votes | 31.92 percent
County Legislator, 6th District
Debra S. Mulé (Democrat) — 15,526 votes | 71.39 percent
Benjamin Jackson (Republican, Conservative) — 6,212 votes | 28.56 percent
County Legislator, 7th District
Douglas J. Segan (Democrat) — 7,452 votes | 28.97 percent
Howard J. Kopel (Republican, Conservative) — 18,254 votes | 70.97 percent
County Legislator, 8th District
Joy Jankunas (Democrat) — 10,387 votes | 38. 44 percent
John J. Giuffre (Republican, Conservative) — 16,618 votes | 61.49 percent
County Legislator, 9th District
Juleigh Chin (Democrat) 13,256 votes | 50.16 percent
Scott P. Strauss (Republican, Conservative) 13,150 votes | 49.76 percent
County Legislator, 10th District
Skylar A. Epstein (Democrat) — 10,350 votes | 38.51 percent
Mazi Melesa Pilip (Republican, Conservative) — 16,508 votes | 61.33 percent
County Legislator, 11th District
Delia M. DeRiggi Whitton (Democrat) — 16,323 votes | 61.41 percent
John Canning (Republican, Conservative) — 10,238 votes | 38.52 percent
County Legislator, 12th District
Michael Vanunu (Democrat) — 12,636 votes | 44.56 percent
Michael J. Giangregorio (Republican, Conservative) — 15,713 votes | 55.41 percent
County Legislator, 13th District
Christina M. Lemyre (Democrat) —12,596 votes | 46.07 percent
Thomas McKevitt (Republican, Conservative) — 14,732 votes | 53.88 percent
County Legislator, 14th District
Cynthia Nuñez (Democrat) — 17,030 votes | 65.93 percent
Anthony B. Capone (Republican, Conservative) — 8,789 votes | 34.03 percent
County Legislator, 15th District
David Louis Boldt Smith (Democrat) — 10,119 votes | 35.69 percent
Kayla Lianne Knight (Republican, Conservative) — 18,224 | 64.28 percent
County Legislator, 16th District
Jared Behr (Democrat) — 14,710 votes | 55.45 percent
Olivia G. Pfeifer (Republican, Conservative) — 11,823 votes | 44.53 percent
County Legislator, 17th District
Ryan J. Johnson (Democrat) — 9,888 votes | 41.81 percent
Rose Marie Walker (Republican, Conservative) — 13,744 votes | 58.12 percent
County Legislator, 18th District
Graham Musynske (Democrat) — 11,179 votes | 39.98 percent
Samantha A. Goetz (Republican, Conservative) — 16,751 votes | 59.90 percent
County Legislator, 19th District
Christine Barlow (Democrat) — 9,427 votes | 30.94 percent
James D. Kennedy (Republican, Conservative) — 21,027 votes | 69.02 percent
Get more local news delivered straight to your inbox. Sign up for free Patch newsletters and alerts.