Health & Fitness
Alexandria Coronavirus Update: Case, Hospitalization Trends
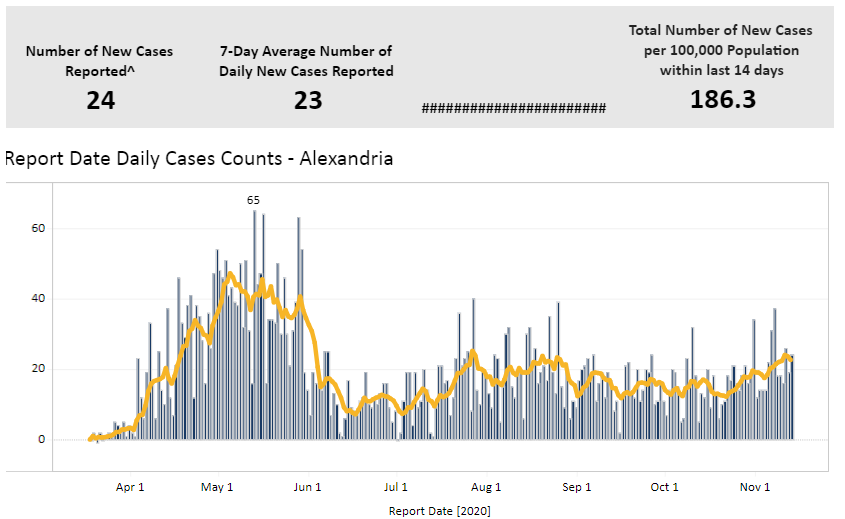
Alexandria's seven-day average of daily cases is up from a month ago but is not near its May peak.


ALEXANDRIA, VA — As Virginia experiences an uptick in the daily coronavirus cases and hospitalization averages, those trends aren't as pronounced in Alexandria.
The latest seven-day average of daily cases is 22.57, which is higher than the 16.14 average a month ago on Oct. 13. Alexandria saw its highest seven-day average of cases during May (47.14), according to Virginia Department of Health data. Since then, cases have been lower with some fluctuations.
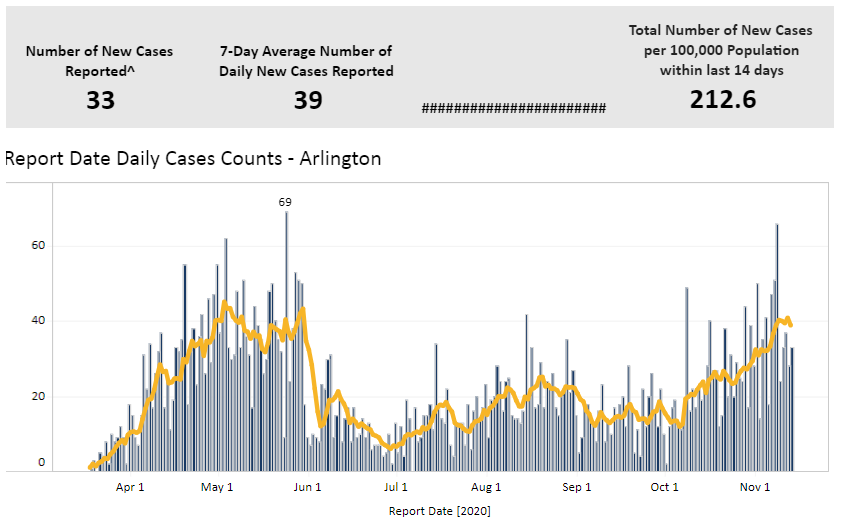
Alexandria's average of daily cases has experienced some increases in recent weeks, but the increase hasn't been as pronounced as neighboring Arlington County's increase. As the graphs below show, Arlington County's seven-day average nearly reached the peak seen in the spring. Alexandria's average increased some in recent weeks but did not get near the spring peak.
Find out what's happening in Old Town Alexandriafor free with the latest updates from Patch.
As for hospitalizations, there have been no consistent up-and-down trends in Alexandria. The seven-day average of new hospitalizations is one. The highest seven-day average had been 6.4 on April 24.
The Death trend has been inconsistent as well, and deaths have not been reported every day in Alexandria. The current seven-day average is 0.
Find out what's happening in Old Town Alexandriafor free with the latest updates from Patch.
To date, 55,476 PCR tests have been completed in Alexandria. The seven-day average of positive PCR tests is 5 percent. A month ago on Oct. 13, the average was 3.7 percent, one of the lowest averages recorded in the city throughout the pandemic.
ZIP code update
The Virginia Department of Health provides cumulative totals of cases and testing by ZIP code, while the Alexandria Health Department provides monthly reports with more specific insights.
The report includes total cases, tests completed, percent positivity of tests, tests per 1,000 Alexandria residents and cases per 1,000 residents. The latest report reflects data as of Oct. 31. Comparisons to past months are shown in the report.
Here are the ZIP code updates compared to data from Oct. 5:
22301 (15,171 population)
- Oct 5: 146 cases, 3,471 tests, 4.2 percent positive rate, 228.8 tests per 1,000 Alexandria residents, 9.6 cases per 1,000 Alexandria residents
- Oct 31: 158 cases, 4,381 tests, 3.6 percent positive rate, 288.8 tests per 1,000 Alexandria residents, 10.4 cases per 1,000 Alexandria residents
22302 (20,238 population)
- Oct 5: 415 cases, 6,163 tests, 6.7 percent positive rate, 304.5 tests per 1,000 Alexandria residents, 20.5 cases per 1,000 Alexandria residents
- Oct 31: 474 cases, 7,778 tests, 6.1 percent positive rate, 384.3 tests per 1,000 Alexandria residents, 23.4 cases per 1,000 Alexandria residents
22304 (54,003 population)
- Oct 5: 1,220 cases, 12,632 tests, 9.7 percent positive rate, 233.9 tests per 1,000 Alexandria residents, 22.6 cases per 1,000 Alexandria residents
- Oct 31: 1,370 cases, 15,267 tests, 9.0 percent positive rate, 282.7 tests per 1,000 Alexandria residents, 25.4 cases per 1,000 Alexandria residents
22305 (16,095 population)
Oct 5: 794 cases, 5,129 tests, 15.5 percent positive rate, 318.7 tests per 1,000 Alexandria residents, 49.3 cases per 1,000 Alexandria residents
Oct 31: 870 cases, 6,068 tests, 14.3 percent positive rate, 377.0 tests per 1,000 Alexandria residents, 54.1 cases per 1,000 Alexandria residents
22311 (shared with Fairfax County, 16,898 estimated population in Alexandria)
- Oct 5: 712 cases, 6,116 tests, 11.6 percent positive rate
- Oct 31: 781 cases, 7,216 tests, 10.8 percent positive rate
22312 (shared with Fairfax County, 6,901 estimated population in Alexandria) 6,901
- Oct 5: 1,010 cases, 7,548 tests, 13.4 percent positive rate
- Oct 31: 1,085 cases, 8,923 tests, 12.2 percent positive rate
22314 (47,826 population)
- Oct 5: 423 cases, 8,248 tests, 5.1 percent positive rate, 172.5 tests per 1,000 Alexandria residents, 8.8 cases per 1,000 Alexandria residents
- Oct 31: 471 cases, 10,229 tests, 4.6 percent positive rate, 213.9 tests per 1,000 Alexandria residents, 9.8 cases per 1,000 Alexandria residents
Demographic breakdown
Based on VDH data, the most cases to date in Alexandria are in the 30s age group, the most hospitalizations are in the 50s age group, and most deaths are in the 80s and up age group. For race and ethnicity, Latino residents continue
Here is the breakdown of cases, hospitalizations and deaths by age group in Alexandria:
- 0-9: 326 cases, 3 hospitalizations, 0 deaths
- 10-19: 321 cases, 6 hospitalizations, 0 deaths
- 20-29: 906 cases, 9 hospitalizations, 1 death
- 30-39: 1,054 cases, 36 hospitalizations, 1 death
- 40-49: 787 cases, 55 hospitalizations, 1 death
- 50-59: 570 cases, 69 hospitalizations, 14 deaths
- 60-69: 342 cases, 65 hospitalizations, 5 deaths
- 70-79: 153 cases, 55 hospitalizations, 21 deaths
- 80 and up: 131 cases, 38 hospitalizations, 33 deaths
- Not reported: 12 cases, 0 hospitalizations, 0 deaths
Here is the breakdown of cases, hospitalizations and deaths by race and ethnicity in Alexandria:
- Asian or Pacific Islander: 169 cases, 11 hospitalizations, 1 death
- Black: 956 cases, 105 hospitalizations, 19 deaths
- Latino: 2,072 cases, 141 hospitalizations, 13 deaths
- Native American: 4 cases, 0 hospitalizations, 0 deaths
- Other race: 125 cases, 10 hospitalizations, 2 deaths
- Two or more races: 32 cases, 2 hospitalizations, 0 deaths
- White: 971 cases, 64 hospitalizations, 40 deaths
Get more local news delivered straight to your inbox. Sign up for free Patch newsletters and alerts.