Politics & Government
Alexandria Health Department Provides Update On COVID-19 ZIP Code, Race, Ethnicity And Age Data From November
The Alexandria Health Department (AHD) has published the latest analysis of COVID-19 case data including cumulative figures and new cases.
Dec 18, 2020 at 2:20 PM
Alexandria Health Department Provides Update on COVID-19 ZIP Code, Race, Ethnicity and Age Data from November
For Immediate Release: December 18, 2020
Find out what's happening in West End Alexandriafor free with the latest updates from Patch.
The Alexandria Health Department (AHD) has published the latest analysis of COVID-19 case data including cumulative figures and new cases by ZIP code, race, ethnicity and age groups.
Updated ZIP Code Data
Find out what's happening in West End Alexandriafor free with the latest updates from Patch.
As of December 1, the Virginia Department of Health (VDH) has reported the following cumulative COVID-19 cases, and the City of Alexandria has provided the estimated population for each
local ZIP code to compare the number of cases per 1,000 residents.
Cumulative ZIP Code Data Summaries (by month)
Estimated Population
(in Alexandria portion of ZIP code)
Date of Report
Confirmed
Cases per ZIP Code
Total People Tested
Positivity Rate 1
Tests per 1,000 Alexandria Residents
Confirmed Cases per 1,000 Alexandria Residents
22206
530
See note (2) belowSee note (2) belowSee note (2) belowSee note (2) belowSee note (2) belowSee note (2) below
22301
15,171
May 7 4
35
282
12.4%
18.6
2.3
2230115,171
June 9
68
685
9.9%
45.2
4.5
2230115,171
July 7
90
1,106
8.1%
72.9
5.9
2230115,171
Aug 5
98
1,760
5.6%
116.0
6.5
2230115,171
Sept 5
127
2,618
4.9%
172.6
8.4
2230115,171
Oct 5
146
3,471
4.2%
228.8
9.6
2230115,171
Oct 31
158
4,381
3.6%
288.8
10.4
2230115,171
Dec 1
217
5,931
3.7%
390.9
14.3
22302
20,238
May 7 4
101
378
26.7%
18.7
5.0
2230220,238June 9
220
1,364
16.1%
67.4
10.9
2230220,238July 7
252
2,636
9.6%
130.3
12.5
2230220,238Aug 5
285
3,592
7.9%
177.5
14.1
2230220,238Sept 5
356
4,736
7.5%
234.0
17.6
2230220,238Oct 5
415
6,163
6.7%
304.5
20.5
2230220,238Oct 31
474
7,778
6.1%
384.3
23.4
2230220,238Dec 1
606
10,471
5.8%
517.4
29.9
22304
54,003
May 7 4
296
1,142
25.9%
21.1
5.5
2230454,003June 9
611
3,418
17.9%
63.3
11.3
2230454,003July 7
707
4,873
14.5%
90.2
13.1
2230454,003Aug 5
851
7,098
12.0%
131.4
15.8
2230454,003Sept 5
1,074
9,923
10.8%
183.7
19.9
2230454,003Oct 5
1,220
12,632
9.7%
233.9
22.6
2230454,003Oct 31
1,370
15,267
9.0%
282.7
25.4
2230454,003Dec 1
1,705
19,569
8.7%
362.4
31.6
22305
16,095
May 7 4
317
572
55.4%
35.5
19.7
2230516,095June 9
572
1,899
30.1%
118.0
35.5
2230516,095July 7
594
2,414
24.6%
150.0
36.9
2230516,095Aug 5
656
3,239
20.3%
201.2
40.8
2230516,095Sept 5
723
4,236
17.1%
263.2
44.9
2230516,095Oct 5
794
5,129
15.5%
318.7
49.3
2230516,095Oct 31
870
6,068
14.3%
377.0
54.1
2230516,095Dec 1
1,031
7,703
13.4%
478.6
64.1
223113
16,898
May 7 4
190 3
517 3
36.8% 3
See note (3) below
See note (3) below
223113
16,898June 9
417 3
1,927 3
21.6% 3
See note (3) below
See note (3) below
223113
16,898July 7
464 3
2,502 3
18.5% 3
See note (3) below
See note (3) below
223113
16,898Aug 5
547 3
3,462 3
15.8% 3
See note (3) below
See note (3) below
223113
16,898Sept 5
643 3
5,059 3
12.7% 3
See note (3) below
See note (3) below
223113
16,898Oct 5
712 3
6,116 3
11.6% 3
See note (3) below
See note (3) below
223113
16,898Oct 31
781 3
7,216 3
10.8% 3
See note (3) below
See note (3) below
223113
16,898Dec 1
944 3
8,740 3
10.8% 3
See note (3) below
See note (3) below
223123
6,901
May 7 4
196 3
659 3
29.7% 3
See note (3) below
See note (3) below
223123
6,901June 9
529 3
2,047 3
25.8% 3
See note (3) below
See note (3) below
223123
6,901July 7
616 3
2,989 3
20.6% 3
See note (3) below
See note (3) below
223123
6,901Aug 5
734 3
4,245 3
17.3% 3
See note (3) below
See note (3) below
223123
6,901Sept 5
908 3
6,004 3
15.1% 3
See note (3) below
See note (3) below
223123
6,901Oct 5
1,010 3
7,548 3
13.4% 3
See note (3) below
See note (3) below
223123
6,901Oct 31
1,085 3
8,923 3
12.2% 3
See note (3) below
See note (3) below
223123
6,901Dec 1
1,337 3
11,112 3
12.0% 3
See note (3) below
See note (3) below
22314
47,826
May 7 4
113
687
16.4%
14.4
2.4
22314 47,826 June 9
185
1,645
11.2%
34.4
3.9
22314 47,826 July 7
216
2,594
8.3%
54.2
4.5
22314 47,826 Aug 5
265
4,142
6.4%
86.6
5.5
22314 47,826 Sept 5
343
6,276
5.5%
131.2
7.2
22314 47,826 Oct 5
423
8,248
5.1%
172.5
8.8
22314 47,826 Oct 31
471
10,229
4.6%
213.9
9.8
22314 47,826 Dec 1
622
13,891
4.5%
290.4
13.0
1 The positivity rate is the number of confirmed cases divided by the number of tests.
2 ZIP code 22206 is mostly in Arlington County; the City of Alexandria portion of data for 22206 is not provided, therefore the numbers and calculations would not be reliable for reporting for Alexandria.
3 ZIP codes 22311 and 22312 are shared between the City of Alexandria and Fairfax County. The number of cases and number of people tested presented in this table, and accompanying calculations, are for the entire ZIP code. Cases per 1,000 Alexandrians cannot be reliably calculated.
4 Data is cumulative from the onset of the pandemic to May 7, and includes cases and tests over a period greater than one month.
The following graph depicts the cumulative total number of PCR tests completed, total number of positive cases, and percent positivity over time by ZIP code.
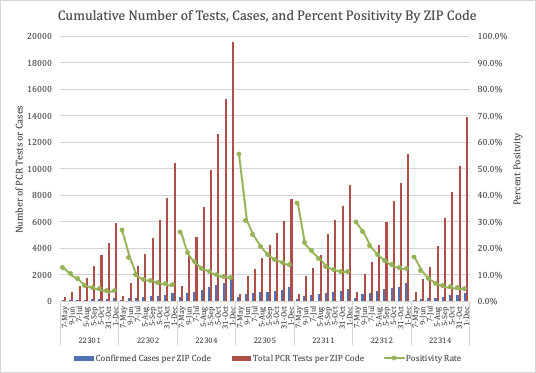
Significant Changes since October Analysis, Using Cumulative Data
As expected with ongoing community transmission of COVID-19, there has been an increase in cumulative positive cases per 1,000 residents. The range of rates in the October analysis was 9.8 (in 22314) to 54.1 (in 22305), and the range in the November analysis is 13.0 to 64.1, with the same ZIP codes having the highest and lowest confirmed cases.
Only one ZIP Code (22301) experienced an increase in cumulative positivity rate since last month's analysis. However, with a cumulative positivity rate of 3.7%, ZIP code 22301 continues to have the lowest rate of all Alexandria ZIP Codes since May. Positivity rates measure the percentage of tests conducted in a population that are positive. This measure is influenced by a number of factors, including how many tests are conducted, who is being tested, and how rapidly the virus is spreading. Percent positivity calculations will also vary depending on how individuals with multiple positive tests are included in the formula. The CDC describes in more detail the different
methodological choices of this calculation. While there is no perfect measure to describe the impact of COVID-19 infections during this pandemic, positivity rate is a widely-used metric despite its limitations. Data presented in the table are based on information shared by VDH and subject to change based on updates.
In the October analysis, the cumulative positivity rate ranged from 3.6% to 14.3%. In the November analysis, the range is 3.7% to 13.4%. The ZIP code with the highest cumulative positivity rates since May remains 22305, but this ZIP code has also experienced a 75.8% reduction in its cumulative positivity rate since the initial analysis.
Monthly ZIP Code Data Summaries
It is also important to look at the data monthly to understand the current state of the pandemic. The following analysis is a monthly snapshot of new cases and tests since the prior month’s report. This month’s report is based on data reported by VDH as of December 1.
ZIP Code
Estimated Population (in Alexandria portion of ZIP code)
Date of Report
Confirmed Cases per ZIP Code
Total People Tested
Positivity Rate 1
Tests per 1,000 Alexandria Residents
Confirmed Cases per 1,000 Alexandria Residents
22206
530
See note (2) below See note (2) below See note (2) below See note (2) below See note (2) below See note (2) below
22301
15,171
May 7 4
35
282
12.4%
18.6
2.3
2230115,171June 9
33
403
8.2%
26.6
2.2
2230115,171July 7
22
421
5.2%
27.8
1.5
2230115,171Aug 5
8
654
1.2%
43.1
0.5
2230115,171Sept 5
29
858
3.4%
56.6
1.9
2230115,171Oct 5
19
853
2.2%
56.2
1.3
2230115,171Oct 31
12
910
1.3%
60.0
0.8
2230115,171Dec 1
59
1,550
3.8%
102.2
3.9
22302
20,238
May 7 4
101
378
26.7
18.7
5.0
2230220,238June 9
119
986
12.1%
48.7
5.9
2230220,238July 7
32
1,272
2.5%
62.9
1.6
2230220,238Aug 5
33
956
3.5%
47.2
1.6
2230220,238Sept 5
71
1,144
6.2%
56.5
3.5
2230220,238Oct 5
59
1,427
4.1%
70.5
2.9
2230220,238Oct 31
59
1,615
3.7%
79.8
2.9
2230220,238Dec 1
132
2,693
4.9%
133.1
6.5
22304
54,003
May 7 4
296
1,142
25.9%
21.1
5.5
2230454,003June 9
315
2,276
13.8%
42.1
5.8
2230454,003July 7
96
1,455
6.6%
26.9
1.8
2230454,003Aug 5
144
2,225
6.5%
41.2
2.7
2230454,003Sept 5
223
2,825
7.9%
52.3
4.1
2230454,003Oct 5
146
2,709
5.4%
50.2
2.7
2230454,003Oct 31
150
2,635
5.7%
48.8
2.8
2230454,003Dec 1
335
4,302
7.8%
79.7
6.2
22305
16,095
May 7 4
317
572
55.4%
35.5
19.7
2230516,095June 9
255
1,327
19.2%
82.4
15.8
2230516,095July 7
22
515
4.3%
32.0
1.4
2230516,095Aug 5
62
825
7.5%
51.3
3.9
2230516,095Sept 5
67
997
6.7%
61.9
4.2
2230516,095Oct 5
71
893
8.0%
55.5
4.4
2230516,095Oct 31
76
939
8.1%
58.3
4.7
2230516,095Dec 1
161
1,635
9.8%
101.6
10.0
223113
16,898
May 7 4
190 3
517 3
36.8% 3
See note (3) below
See note (3) below
223113
16,898June 9
227 3
1,410 3
16.1% 3
See note (3) below
See note (3) below
223113
16,898July 7
47 3
575 3
8.2% 3
See note (3) below
See note (3) below
223113
16,898Aug 5
83 3
960 3
8.6% 3
See note (3) below
See note (3) below
223113
16,898Sept 5
96 3
1,597 3
6.0% 3
See note (3) below
See note (3) below
223113
16,898Oct 5
69 3
1,057 3
6.5% 3
See note (3) below
See note (3) below
223113
16,898Oct 31
69 3
1,100 3
6.3% 3
See note (3) below
See note (3) below
223113
16,898Dec 1
163 3
1,524 3
10.7% 3
See note (3) below
See note (3) below
223123
6,901
May 7 4
196 3
659 3
29.7% 3
See note (3) below
See note (3) below
223123 6,901June 9
333 3
1,388 3
24.0% 3
See note (3) below
See note (3) below
223123 6,901July 7
87 3
942 3
9.2% 3
See note (3) below
See note (3) below
223123 6,901Aug 5
118 3
1,256 3
9.4% 3
See note (3) below
See note (3) below
223123 6,901Sept 5
174 3
1,759 3
9.9% 3
See note (3) below
See note (3) below
223123 6,901Oct 5
102 3
144 3
6.6% 3
See note (3) below
See note (3) below
223123 6,901Oct 31
75 3
1,375 3
5.5% 3
See note (3) below
See note (3) below
223123 6,901Dec 1
252 3
2,189 3
11.5% 3
See note (3) below
See note (3) below
22314
47,826
May 7 4
113
687
16.4%
14.4
2.4
22314
47,826
June 9
72
958
7.5%
20.0
1.5
22314
47,826
July 7
31
949
3.3%
19.8
0.6
22314
47,826
Aug 5
49
1,548
3.2%
32.4
1.0
22314
47,826
Sept 5
78
2,134
3.7%
44.6
1.6
22314
47,826
Oct 5
80
1,972
4.1%
41.2
1.7
22314
47,826
Oct 31
48
1,981
2.4%
41.4
1.0
22314
47,826
Dec 1
151
3,662
4.1%
76.6
3.2
1 The positivity rate is the number of confirmed cases divided by the number of tests.
2 ZIP code 22206 is mostly in Arlington County; the Alexandria portion of data for 22206 is not provided, therefore the numbers and calculations would not be reliable for reporting for Alexandria.
3 ZIP codes 22311 and 22312 are shared between Alexandria and Fairfax County. The number of cases and number of people tested presented in this table, and accompanying calculations, are for the entire ZIP code. Cases per 1,000 Alexandrians cannot be reliably calculated.
4 Data is cumulative from the onset of the pandemic to May 7 and includes cases and tests over a period greater than one month.
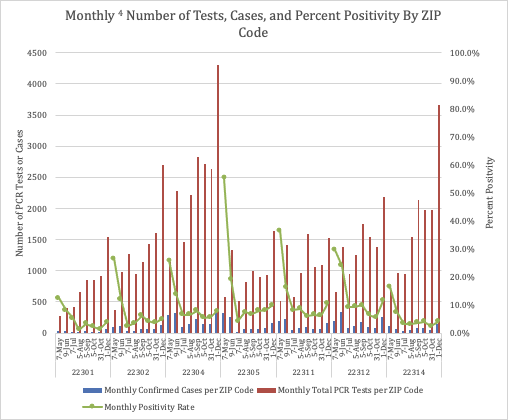
Analysis of Monthly Data
All ZIP codes have experienced increases in positivity rates from the October report to the November report, which is expected based on the current regional and nationwide surge in cases.
The total number of PCR tests in the November analysis period was 17,555, which is 7,000 more than the prior month. The number of tests obtained by residents increased in all ZIP codes in November.
Since the beginning of the pandemic, AHD has worked with Alexandria’s health care providers and community partners to increase both testing availability and testing awareness across all ZIP codes in Alexandria. Prevention of new infections remains a priority, and timely testing is one part of the multipronged pandemic response strategy. It is important for all members of the community to stay home when ill, practice physical distancing, wear masks correctly and continuously in public, wash hands frequently, and cooperate with case investigations and contact tracing when called by public health staff.
Disproportionate Impact of COVID-19 by Race and Ethnicity
Everyone is at risk for COVID-19, but it has disproportionately affected vulnerable populations throughout the United States, in Virginia, regionally, and within Alexandria, due to underlying systemic inequities. VDH has published data on COVID-19 cases by race and ethnicity since the middle of June. The following tables and graphs present the cumulative case data by month.
Cumulative Race and Ethnicity Data Summary
Race or Ethnicity
Cumulative Cases as of July 5
Cumulative Cases as of August 5
Cumulative Cases as of September 5
Cumulative Cases as of October 5
Cumulative Cases as of October 31
Cumulative Cases as of Dec 1
Latino
1,306 (55.0%)
1,482 (51.6%)
1,656 (47.6%)
1,820 (46.3%)
1,983 (45.7%)
2,333 (43.2%)
Black
347 (14.6%)
524 (18.2%)
703 (20.2%)
816 (20.8%)
898 (20.7%)
1089 (20.2%)
White
451 (19.0%)
531 (18.5%)
672 (19.3%)
770 (19.6%)
894 (20.6%)
1197 (22.2%)
Asian or Pacific Islander
84 (3.5%)
99 (3.4%)
121 (3.5%)
139 (3.5%)
162 (3.7%)
196 (3.6%)
Other Race
40 (1.7%)
48 (1.7%)
76 (2.2%)
84 (2.1%)
108 (2.5%)
145 (2.7%)
Two or more races
4 (0.2%)
6 (0.2%)
21 (0.6%)
28 (0.7%)
29 (0.7%)
45 (0.8%)
Native American
3 (0.1%)
2 (0.1%)
3 (0.1%)
4 (0.1%)
4 (0.1%)
4 (0.1%)
Not Reported
141 (5.9%)
180 (6.3%)
224 (6.4%)
266 (6.8%)
259 (6.0%)
395 (7.3%)
Total
2,376
2,872
3,476
3,927
4,337
5,404
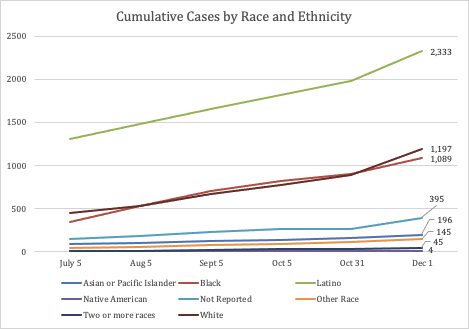
Individuals who identify as Latino or Hispanic make up 16.8% of the population in Alexandria but represent 43.2% of the diagnosed COVID-19 infections as of December 1. There has been a decline in the proportion of cumulative COVID-19 infections diagnosed among Latinos over time.
Monthly New Case Race and Ethnicity Data
Race
New Cases from July 6-August 5
New Cases from August 6-September 5
New Cases from September 6-October 5
New Cases from October 6-October 31
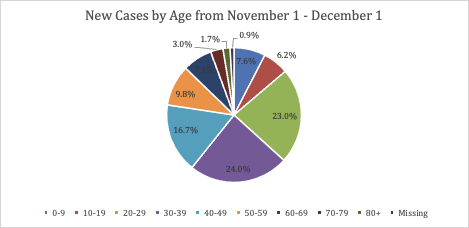
New Cases from November 1-December 1
Latino
176 (35.5%)
174 (28.8%)
164 (36.4%)
163 (39.8%)
350 (32.8%)
Black
177 (35.7%)
179 (29.6%)
113 (25.1%)
82 (20.0%)
191 (17.9%)
White
80 (16.1%)
141 (23.3%)
98 (21.7%)
124 (30.2%)
303 (28.4%)
Asian or Pacific Islander
15 (3.0%)
22 (3.6%)
18 (4.0%)
23 (5.6%)
34 (3.2%)
Other Race
8 (1.6%)
28 (4.6%)
8 (1.8%)
24 (5.9%)
37 (3.5%)
Two or more races
2 (0.4%)
15 (2.5%)
7 (1.6%)
1 (0.2%)
16 (1.5%)
Native American
-1 (-0.2%) 5
1 (0.2%)
1 (0.2%)
0 (0.0%)
0 (0.0%)
Not Reported
39 (7.9%)
44 (7.3%)
42 (9.3%)
-7 (-1.7%) 5
136 (12.7%)
Total
496
604
451
410
1,067
5 Interval data is calculated from cumulative data provided by VDH which is subject to changes.
When looking at COVID-19 cases reported from November 1 through December 1, 17.9% of cases were among residents who identify as Black, which is a decrease from the prior report’s 20.0%. Residents who identify as Latino or Hispanic comprised 32.8% of cases during the same period, which is a decrease from the prior report’s 39.8%. The percentage of newly reported cases of COVID-19 among people identifying as white decreased in this analysis, from 30.2% to 28.4%. It is important to keep in mind that the proportion of cases increased this month to 12.7% among those whose race was not reported. If cases were proportionate by population groups, AHD would expect to see whites with the highest number of cases and almost double the number of cases compared to the Black population.
Disproportionate Impact of COVID-19 by Age
When looking at cumulative data, the largest proportion of cases continue to be among those 30 to 39 years old, which is to be expected based on Alexandria’s population.
Cumulative Age Data Summary
Age (yrs)
May 5
June 5
July 5
August 5
September 5
October 5
October 31
December 1
0-9
41
116
133
162
217
265
301
382
10-19
50
134
170
211
241
279
307
373
20-29
138
311
377
499
634
740
841
1,086
30-39
247
479
549
663
810
902
981
1,237
40-49
187
390
439
530
614
681
747
925
50-59
131
264
305
359
445
493
545
650
60-69
87
173
200
232
268
292
323
399
70-79
57
90
101
108
121
140
150
182
80+
44
78
90
97
115
124
130
148
Missing
1
10
12
11
11
11
12
22
Total
983
2,045
2,376
2,872
3,476
3,927
4,337
5,404
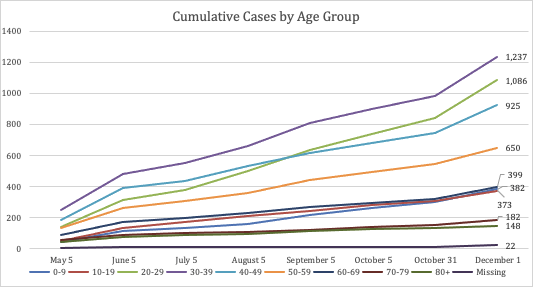
Monthly New Case Age Data Summary
Those who are 30 to 39 years old represent the largest proportion of newly reported cases from November 1 to December 1. There was an increase in cases during this same time period among all age groups.
Age (yrs)
New Cases (May 6-June 5)
New Cases (June 6-July 5)
New Cases (July 6-Aug 5)
New Cases (Aug 6-Sept 5)
New Cases (Sept 6-Oct 5)
New Cases (Oct 6-Oct 31)
New Cases (Nov 1-Dec 1)
0-9
75
17
29
55
48
36
81
10-19
84
36
41
30
38
28
66
20-29
173
66
122
135
106
101
245
30-39
232
70
114
147
92
79
256
40-49
203
49
91
84
67
66
178
50-59
133
41
54
86
48
52
105
60-69
86
27
32
36
24
31
76
70-79
33
11
7
13
19
10
32
80+
34
12
7
18
9
6
18
Missing
9
2
-1 5
0
0
1
10
Total
1,062
331
496
604
451
410
1,067
5 Interval data is calculated from cumulative data provided by VDH which is subject to changes.
What the Alexandria Health Department is Doing
AHD is a mission-driven organization whose response to this pandemic is consistent with its public health justice principles.
AHD activities in the past month to combat the COVID-19 pandemic include:
-
Responded to cases and outbreaks in the community. AHD
case investigators and contact tracers work seven days a week to help minimize the spread of COVID-19 infection. -
Provided technical support to Neighborhood Health to organize and coordinate regularly targeted testing events for communities who may have otherwise had limited access to testing and for those who have been exposed to a positive COVID-19 case. AHD analyzes data and identifies these communities based on need. There are eight testing events planned for
December. AHD and the City maintain resources regarding local
testing facilities where Alexandrians can get tested any day of the week. -
Supported City agencies, faith-based organizations, schools, daycares, and governmental leadership with recommendations based on up-to-date COVID-19 epidemiology and research.
-
Responded to complaints about businesses not adhering to the state
executive order on masks and supported businesses in their commitment to the
ALX Promise. -
Provided personal protective equipment (PPE) to Alexandria healthcare providers that offer COVID-19 testing. With volunteer support from the
Alexandria Medical Reserve Corps, AHD distributes surgical masks, medical gowns, medical gloves and face shields free of charge when supplies are available -
Continued AHD’s COVID-19
vaccination preparations, using the principles of maximizing benefits and reducing harm, promoting justice, mitigating health inequities, and maintaining transparency.
# # #
This news release is available at
alexandriava.gov/119451.
This press release was produced by the City of Alexandria.The views expressed here are the author’s own.