Politics & Government
Lake Forest Animal Network. Part 7 - Errors and Discrepancies
A more detailed analysis of staff report

Yesterday I went through the staff report’s main conclusions and pointed out which were wrong (5 of them), partially wrong (4), or accurate (2). I intended to go through the rest of the report line by line and point out the problems, but there are so many it would not be productive. Instead I’ll just function on some common threads and major issues. Two of the major issues are staff errors and the discrepancies in the data, and I’ll deal with these today. Tomorrow I’ll talk about where we all agree.
ERRORS
Adoptable Dogs
Find out what's happening in Lake Forestfor free with the latest updates from Patch.
The staff report makes an error in reporting “Adoptable Dogs July 15 to August 15” (See page 35). They claimed as many as 10 adoptable dogs were in the system at the time, with as few as 2 and an average of 5+. But included in the so-called “adoptable dogs” are dogs who were placed in quarantine, dogs held for behavioral observation, dogs surrendered by their owners for euthanasia, and dogs returned to their owners. None of these dogs should be classified as “adoptable”. Here is the real data. I’ll start before July 15 and continue past August 15.
1. July 3 - Quarantine – Disposal 7/7 (not adoptable)
Find out what's happening in Lake Forestfor free with the latest updates from Patch.
2. July 5 – Returned to owner (aka RTO) 7/6 (not adoptable)
3. July 6 - Owner Requested Euthanasia - Euthanized 7/6 (not adoptable)
4. July 8 - Owner Surrender Euthanasia - Euthanized 7/10 (not adoptable)
5. July 8 – Stray – Adopted by rescue 7/19 (ADOPTABLE)
6. July 9 – Quarantine – RTO 7/16 (not adoptable)
7. July 10 – RTO 7/11 (not adoptable)
8. July 11 – Quarantine – Disposal 7/16 (not adoptable)
9. July 12 – Stray – Transfer to rescue 8/8 (ADOPTABLE)
10. July 14 – Behavioral Observation – Euthanized 7/21 (not adoptable)
11. July 21 – Quarantine – Disposal 7/22 (not adoptable)
12. July 24 - Owner surrender – Adopted by rescue 8/12 (ADOPTABLE)
13. July 24 - Owner surrender – Adopted by rescue 8/12 (ADOPTABLE)
14. July 26 – Owner Requested Euthanasia - Euthanized 7/26 (not adoptable)
15. July 26 – Quarantine – RTO 8/5 (not adoptable)
16. July 29 - Owner Surrender Euthanasia - Euthanized 7/29 (not adoptable)
17. July 29 – Stray – Adopted 10/30 (ADOPTABLE)
18. July 29 – Stray – Adopted 10/30 (ADOPTABLE)
19. July 30 – Private Cremation – Euthanized 8/1 (not adoptable)
20. Aug 1 - Owner Requested Euthanasia - Euthanized 8/1 (not adoptable)
21. Aug 2 – RTO – 8/2 (not adoptable)
22. Aug 2 – RTO – 8/2 (not adoptable)
23. Aug 2 – Stray – Adopted 8/7 (ADOPTABLE)
24. Aug 2 – Stray – Adopted 8/14 (ADOPTABLE)
25. Aug 3 – Stray – Adopted by rescue 8/27 (ADOPTABLE)
26. Aug 4 – RTO – 8/5 (not adoptable)
27. Aug 4 – RTO – 8/5 (not adoptable)
28. Aug 6 – Behavioral Observation – Euthanized 8/13 (not adoptable)
29. Aug 9 - Owner Requested Euthanasia - Euthanized 8/9 (not adoptable)
30. Aug 9 – RTO – 8/11 (not adoptable)
31. Aug 22 - Owner Requested Euthanasia - Euthanized 8/22 (not adoptable)
You can see for yourself that while 20 dogs came into the system between July 15 and Aug 15, only 7 were adoptable. Among the other 13, 6 were Returned to their owners, 4 were owner requested euthanasia or cremation, 2 Quarantine, and 1 Behavioral Observation.
Without turning this article into a Ph.D. thesis, take my word that going into July 15 there were only two adoptable dogs in the system. Therefore, from July 15 to August 15, there were never more than 8 dogs in the system (not the 9 and 10 identified by the staff). Moreover, the staff report claims that there were 8 or more dogs in the system on 10 of the 30 days, while in truth there were never more than 8 dogs in the system and this happened on 5 not 10 days.
As a result of this type of error, many of the conclusions later reached in the staff report are flawed and misleading. For example, on page 38 staff claims “…the adoption center would likely necessitate a facility of a likely minimum of approximately 1,900 square feet”, but this conclusion is based on their faulty capacity analysis. In turn, mis-calculating the size of the adoption center will lead to mis-calculating the costs of leasing a retail space, and so on down the line.
FWIW this type of detailed analysis is not particularly easy and is rarely done. In addition it requires a certain skill set and knowledge of the animal care industry. So it’s not surprising to see staff making errors, especially when they are trying to do this “independently”. What may seem “adoptable” to staff may not be looked upon as “adoptable” by experts in the animal care industry, and hence the over-statement of animal capacity by staff.
DATA DISCREPANIES
Classification
As noted in the report, there are discrepancies in the counts produced by the City compared to my accounts. When this is not due to staff errors (as indicated above) in most cases they come from the fact that the database supplied by OCAC is not sufficiently edited in such a manner that you can produce results which are 100% in agreement. Depending upon which column you choose to use, you get different numbers for the same category. For example, if you wanted to know how many animals in the system were there to get a “Head Test”, under the column “Intake Condition” there is only 1 animal listed (an English Bulldog). Under “Outcome Type” there are 0 animals listed but under “Outcome Subtype” there are 20 animals listed. So how many were there?
Want to do it again? Take “Owner Requested Euthanasia”. Under “Outcome Subtype” it looks like 50 animals, but under “Intake Comments” there are only 5, and under “Intake Condition” there are 0. Look at the column “Charge Type” and there are 40 “Owner Surrender” listed, yet every “Owner Requested Euthanasia” must be an “Owner Surrender”, by definition, so how can there be fewer surrenders than euthanized, when they must at the very least be equal, and more likely a higher number (not all surrenders are euthanized, but all owner requested euthanized have to be surrendered).
(It’s important to note that in reality OCAC does not have any legally owner requested euthanasia animals. OCAC may be the only shelter in the world that does not have an owner requested euthanasia form, as recommended by authorities everywhere. Instead OCAC has an owner surrender form and the decision to euthanize an animal is made by OCAC staff.)
With such a poor classification system, it’s a wonder that we got as much agreement as we did. Of course we know that OCAC does a miserable job in everything they do, including data management. Not so long ago I proved that their method of calculating euthanasia rates was deeply flawed, and the County ultimately agreed and changed the way they calculate it. After that, when Lake Forest resident Randy Johnson pointed out that OCAC was mis-calculating the license compliance data, I confronted them and again they admitted their mistakes and promised to correct the errors (they haven’t yet).
While I was busy preparing the proposal, I got a bill for my dog, Tizzie. But I had recently paid for my dog license, so I called up OCAC to see what happened. Sure enough, they have been billing me for years twice for the same dog. Just another example of their incompetence.
I can’t honestly say that “I’m right and the City is wrong” when it comes to the discrepancies. The City staff doing this report has been very conscientious and I’m going to assume they are right, but that doesn’t mean that I’m wrong. It simply means that when you’re dealing with such a messy pie, it’s hard to get agreement.
Intake and Outcome
Intake and outcome are very important figures because they bear directly on the budget. Classification is also important because it too has budgetary implications, but intake and outcome weigh more heavily. Let’s take a look at what these findings are –
Dog Intake (-3)
· Proposal – 203
· City – 200
Cat Intake (-27)
· Proposal – 144 (I included the 44 dead in my list, the City didn’t)
· City – 117
Bird Intake (67) and Other Intake (89) were in agreement.
If anything, the City’s number indicate fewer animals than I projected. It’s the same thing with outcome. The City proposal found 444 outcomes while I found 495. Once again the City’s numbers show fewer animals in the system. That’s a good thing, because my cost estimates are based on the intake and outcome figures, so if the City’s calculations have 30 fewer intakes and 51 fewer outcomes, the budget should be lower than I anticipated.
The differences are summed up in the City report on page 23. In my proposal I anticipated an average of 2 live animals per day while the City anticipates 1 live animal. Once again, this implies that my budget calculations are overly pessimistic, which is a good thing.
Once again, the City isn’t wrong and neither am I. It depends on what Column you are using, and although I pointed out this potential problem before we began, the City went ahead and did their calculations without reference to my own work. That’s a good thing because it means the two calculations are completely independent. But when you’re dealing with a messy database, it means these discrepancies are going to emerge. Had the differences been in the other direction (i.e., the City found far more than I found) my budget projections would have to be revised upwards. Since they found less, my projections could be lowered.
Field Services
According to the County’s website, in 2014 they performed 2,277 field services. Click Here if you want to see for yourself. But the City’s report lists 2,385 field services. Why the discrepancy? I don’t know. I’m using official public statistics on the official OCAC website. City staff found 108 extra field services somewhere. In any event, 108 extra field services in a total of 2385 is less than a 5% difference. The staff is being disingenuous when they claim that the difference is 6 services per day vs. 7 services a day, a difference of 17%. In truth, the difference is between 6.24 services per day (my proposal) vs. 6.53 services per day (City), a difference of less than 5%. The City makes it look like the differences are much greater than they really are, calling into question my budgetary projections when the actual data is much closer.
Capacity
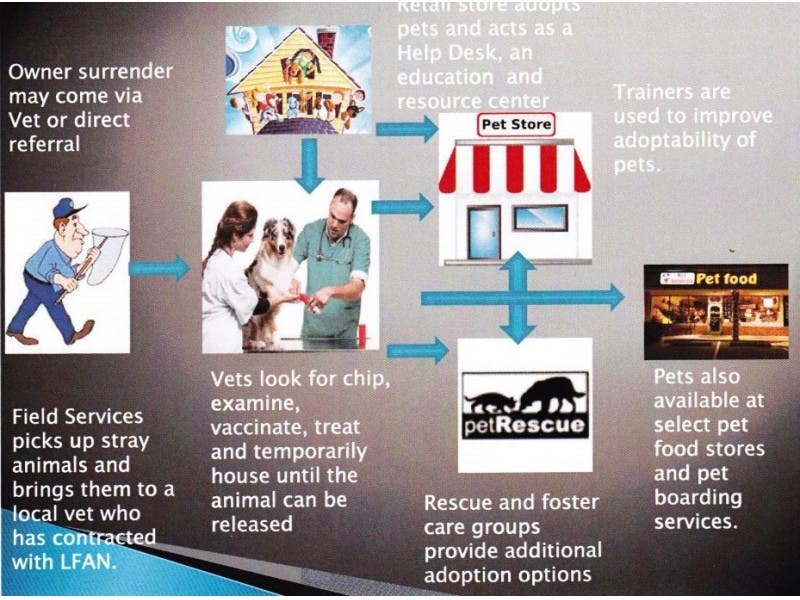
The City staff capacity analysis (page 29) and mine differ because the City is using total capacity and my analysis (rightly) looked only at Adoption Center capacity. Many of the animals who enter the system will never get to the Adoption Center. 129 dogs and 34 cats will be quarantined, observed, tested, returned to owner, or be so sick/injured on entry they will be euthanized. Though they enter the system, they will remain at the Vet’s offices. The report erroneously and alarmingly states – “The potential danger in underestimating the program’s volume is that animals would have to be turned away.” This is nonsense. Even if the City’s figures were vaguely accurate, which they aren’t, using this model allows for animals to be kept at the Vet offices if the Adoption Center is full. In fact, it’s built into the budget. In addition, rescue and foster groups can be utilized, as shown in the model flowchart.
SUMMARY
Staff made errors in certain critical areas and these errors in turn influenced some of their decision making with regards to capacity and budget. These ultimately found their way into many of their conclusions. Instead of releasing the report to the public they should have given it to me to edit/comment first, and many of these errors and mis-understandings could have been avoided and a better report would have been the result. In contrast, I produced two or three updates of my proposal every week, eventually coming up with 20 versions, all of which I shared liberally and got back many many useful suggestions that ultimately found their way into my final version
Tomorrow let’s look at where we have common ground.
ABOUT THE AUTHOR
Dr. Jim Gardner is on the City Council for Lake Forest. You can check him out on LinkedIn and/or Facebook and you can share your thoughts about the City at Lake Forest Town Square on Facebook. His comments are not meant to reflect official City Policy.
Dr. Gardner has office hours every Tuesday from 4 pm to 6 pm at the City Hall. In addition, he holds a Town Hall meeting every quarter. The next meeting will be on March 26 at 2 pm at the Foothill Ranch Public Library.