Politics & Government
Sewer Science and our Local Silicon Valley Clean Water Facility
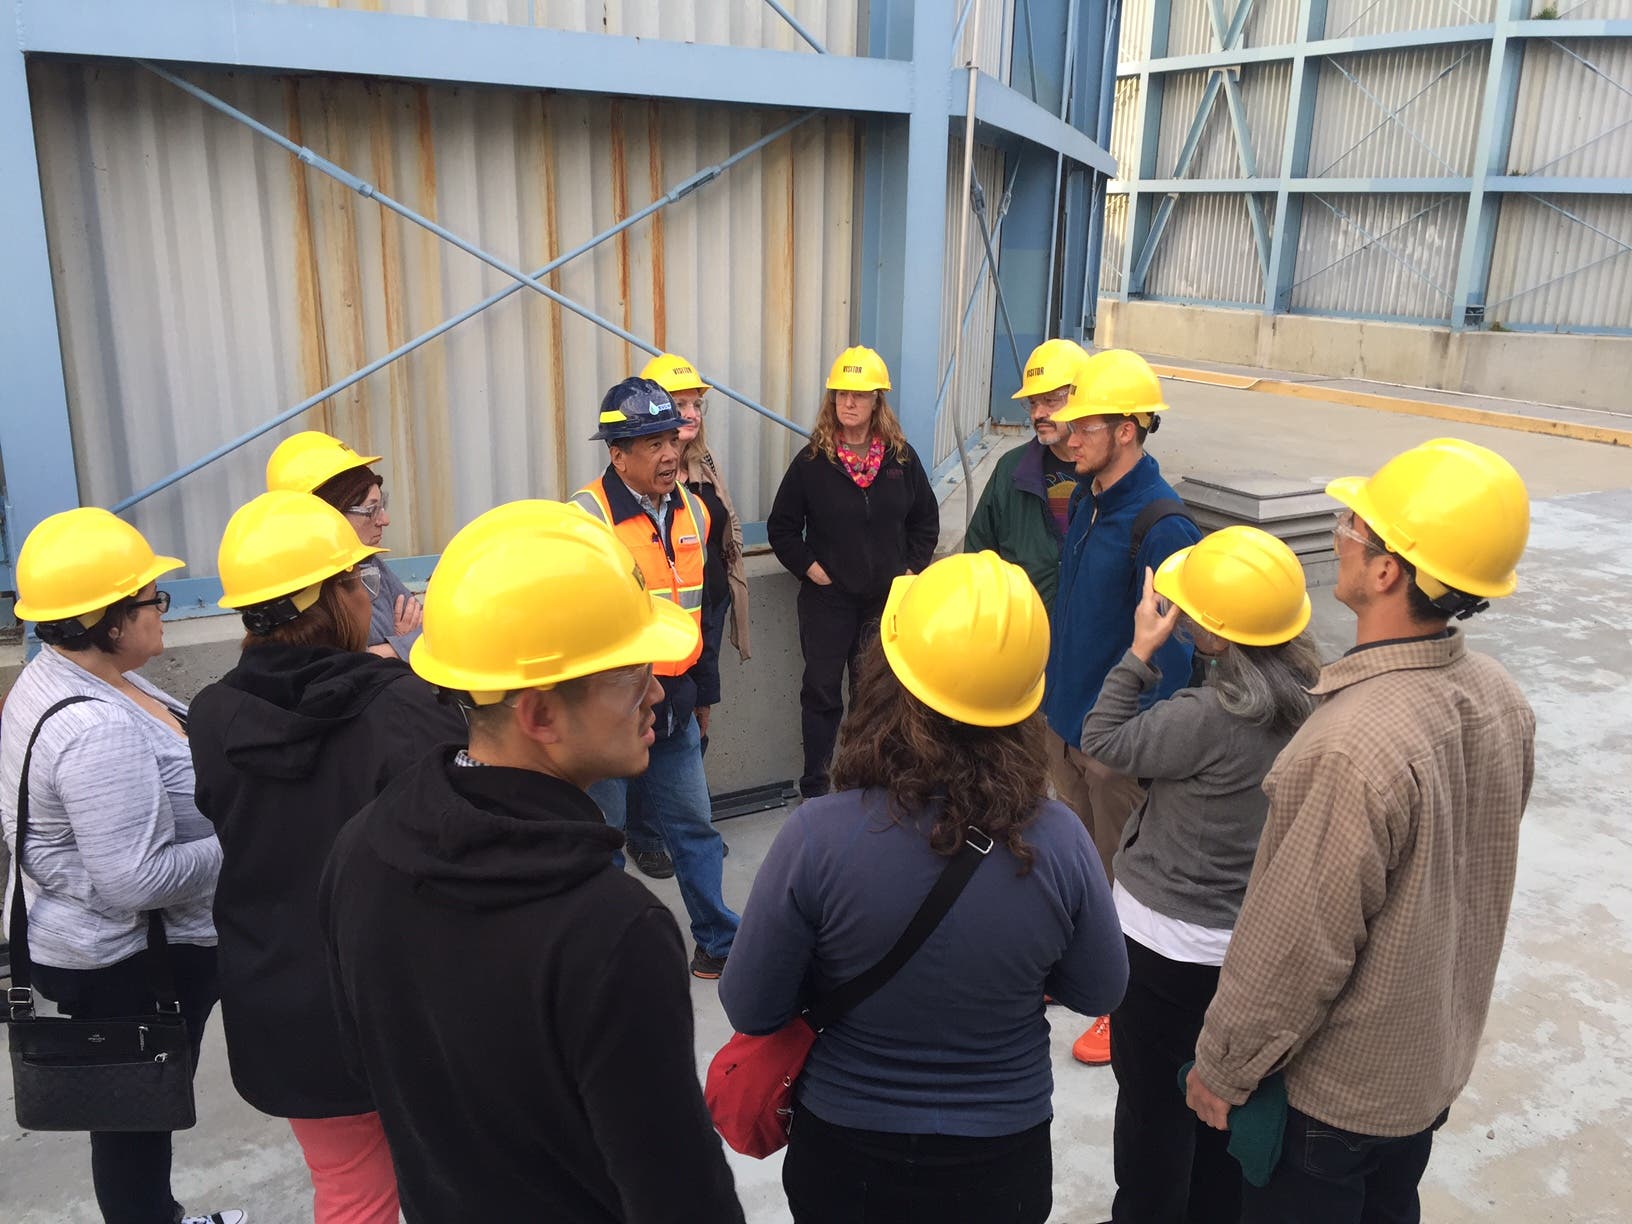
Take a free tour of Silicon Valley Clean Water and learn more about what happens when you take a shower or flush the toilet.


When the human population of an area increases the local environment is impacted. In addition when the composition of an area changes from agricultural or industrial to more residential and or office there are changes. These impacts include changes in water usage and sewage production. The more or less water comes into a home, building or facility; the more or less water needs to leave.
The water that leaves residences or industrial buildings is sometimes all mixed up into one exit stream but it is possible to really separate it into various streams: like gray water, black water or industrial waste water. Gray water is considered to be water from showers, washing machines and non-oil and food based sinks such as bathroom sinks. Black water is toilet flushes and water containing food and oil like kitchen sinks. Industrial waste water is usually contaminated with a specific mix of chemicals due to a particular use of an industrial facility. The difference between these waters is the amount of treatment the water needs to receive prior to being released back into the environment.
Redwood City, West Bay Sanitary (Menlo Park, Atherton, Portola Valley, and parts of East Palo Alto and Woodside), Belmont and San Carlos do not currently separate the various sources of waste water although that is something that should be considered. Currently all four entities sewage pumps and pipes merge into one big central pipe for treatment at the Silicon Valley Clean Water (SVCW) joint powers facility located near the San Francisco Bay in Redwood Shores. The sewage that arrives at SVCW goes through four treatment stages after which the remaining solids are trucked to the Central Valley (read about some new processes being tested), some of the water is recycled for reuse and some is released back into the bay.
Find out what's happening in Redwood City-Woodsidefor free with the latest updates from Patch.
Throughout the years the Silicon Valley Clean Water facility has treated varying amounts of waste water. Comparing the industrial usage of the facility with the baseline year of 2000 when 1.18 million gallons per day (MGD) of industrial waste were treated shows the level of variability in the flows.
| Year | Average flows in MGD | percent change |
| 2007 | 0.37 | -10% |
| 2008 | 0.61 | +61% |
| 2009 | 0.26 | -57% |
| 2010 | 0.30 | +15% |
| 2011 | 0.29 | -3% |
| 2012 | 0.28 | -3% |
| 2013 | 0.27 | -4% |
| 2014 | 0.46 | +54% |
| 2015 | 0.24 | -48% |
| 2016 | 0.21 | -13% |
Effectively since 2000 industrial flows have decreased approximately 82% in the service area.
Find out what's happening in Redwood City-Woodsidefor free with the latest updates from Patch.
Which can be good news or bad news depending on what vantage point you are coming from. Realistically rates have needed to be increased to make up for what otherwise would be lost revenue.
Stay tuned for more posts on the subject.
To learn more about sewer science and the Silicon Valley Clean Water facility you can take a free tour of the facility. Register at Eventbrite.