Schools
Douglas County's Graduation Rate Declines For 3rd Year: Report
Find out more interesting facts about the Douglas County School System, according to their newly-released annual report.


DOUGLASVILLE, GA — High school graduation rates in Douglas County fell for the third straight year, but only .09 percent less than the previous year, according to the school system's annual report. The Douglas County School System's graduation rate in 2017 was 87.04 percent, compared to 87.13 percent in 2016. Douglas County still surpassed the 2017 Georgia graduation rate of 80.56 percent.
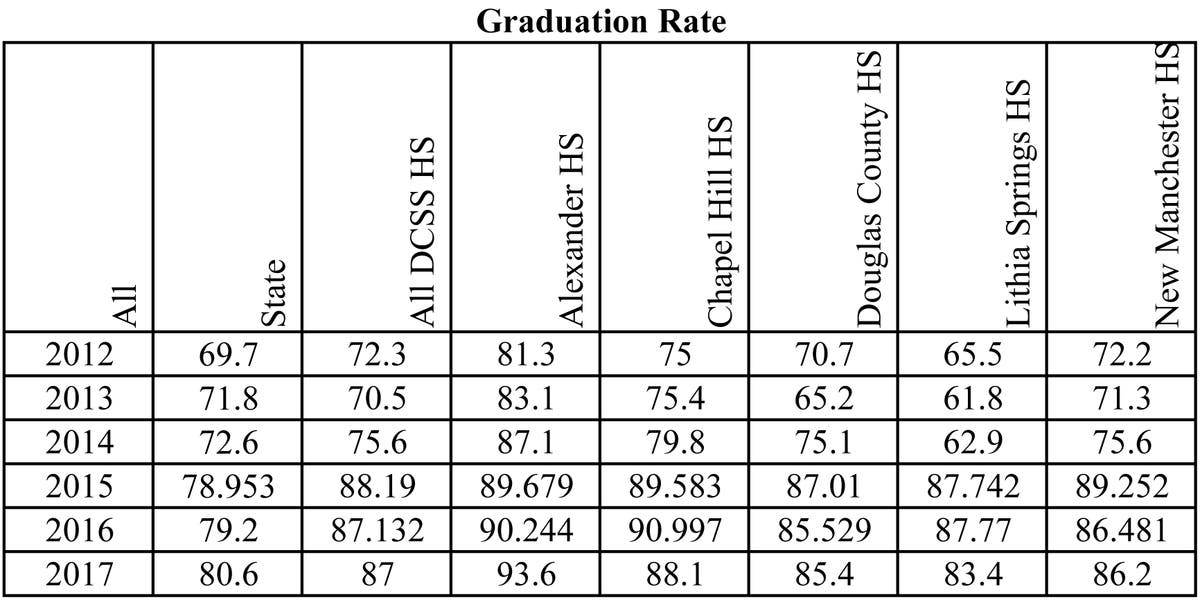
The State of Georgia's graduation rates have improved over the past three years, while the Douglas County rates have declined slightly. Here's how graduation rates compared over the past three years:
2015
Georgia: 78.95% Douglas County: 88.19%
Find out what's happening in Douglasvillefor free with the latest updates from Patch.
2016
Georgia: 79.43% Douglas County: 87.13%
2017
Georgia: 80.56% Douglas County 87.04%
Find out what's happening in Douglasvillefor free with the latest updates from Patch.
The following chart, provided by the school system, indicates how each Douglas County High School has done since 2012 compared to the state average.
Over the 2016-2017 school year, the Douglas County School System spent $8,894 per pupil and 62.11 percent of pupils received free or reduced lunches, according to the school system's annual report.
There are 33 schools within the school system, made up of 20 elementary, eight middle and five high schools. Douglas County is the 17th largest school system in Georgia.
The average number of students per instructional staff, including both teachers and para professionals, broke down like this:
Elementary School 12.6
Middle School 13.5
High School 16.1
The total number of students and teachers in the school system, not including students or teachers at Brighten Academy charter school or Youth Villages, were as follows:
25,483 Students
3,159 Employees (approximately)
1,940 Certified staff
1,349 Certified staff with advanced degrees
Here are student demographics, by race:
Black 52.8 percent
White 25.9 percent
Hispanic 15.4 percent
Two or more races 4.3 percent
Asian 1.2 percent
Pacific Islander .2 percent
American Indian .1 percent
Image via Shutterstock
Get more local news delivered straight to your inbox. Sign up for free Patch newsletters and alerts.