Politics & Government
Douglasville, Lithia Springs Grow 38% in a Decade
Since 2000 Douglas County's population increased by nearly 44%.


Douglas County's population netted substantial growth over the past decade despite a slowdown in home construction and a rash of forclosures the past two years.
The population of the Douglasville-Lithia Springs Census County Division grew by 38.3 percent over the decade from 50,762 in April 2000 to 70,215 in April 2010, according to official census figures.
The increase roughly tracks the 43.6 percent increase in Douglas County's population of 92,174 in 2000 to 132,403 in 2010, according to census records released Thursday.
Find out what's happening in Douglasvillefor free with the latest updates from Patch.
Neighboring Cobb County, with 688,078 residents counted in the 2010 census, is Georgia's fourth-largest county in population and has more than five times the population of Douglas. Its population also increased over the decade, but at a lower 13.2 percent.
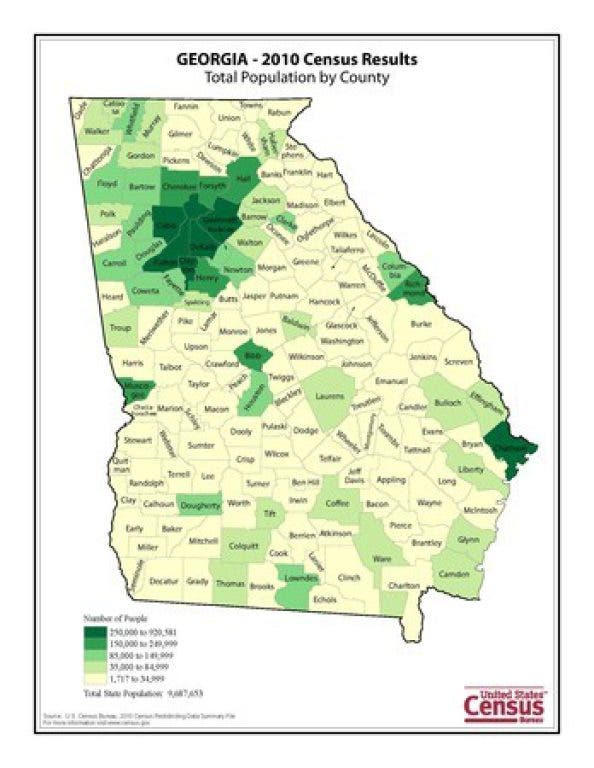
Overall, Georgia’s largest county is Fulton, with a population of 920,581. Its population grew by 12.8 percent since 2000. The other counties in the top five are Gwinnett with a population of 805,321 (increase of 36.9 percent); DeKalb, 691,893 (increase of 3.9 percent); and Chatham, 265,128 (increase of 14.3 percent).
Find out what's happening in Douglasvillefor free with the latest updates from Patch.
Georgia's population grew 18.3 percent over the decade to 9.69 million people.
The following charts provide more detail about the most recent census numbers for Douglas County and Georgia.
Total18 years and over NumberPercentNumberPercent Total population 70,215 100.0 50,265 100.0 2000 population 50,762
36,851
Increase 19,453 38.3 13,414 36.4 RACE One race 68,418 97.4 49,441 98.4 White 29,265 41.7 23,154 46.1 Black or African American 34,413 49.0 23,210 46.2 American Indian and Alaska Native 223 0.3 171 0.3 Asian 901 1.3 710 1.4 Native Hawaiian and Other Pacific Islander 75 0.1 49 0.1 Some Other Race 3,541 5.0 2,147 4.3 Two or More Races 1,797 2.6 824 1.6 HISPANIC OR LATINO AND RACE Hispanic or Latino (of any race) 7,341 10.5 4,332 8.6 Not Hispanic or Latino 62,874 89.5 45,933 91.4 One race 61,568 87.7 45,352 90.2 White 26,394 37.6 21,472 42.7 Black or African American 33,878 48.2 22,909 45.6 American Indian and Alaska Native 178 0.3 143 0.3 Asian 881 1.3 695 1.4 Native Hawaiian and Other Pacific Islander 66 0.1 41 0.1 Some Other Race 171 0.2 92 0.2 Two or More Races 1,306 1.9 581 1.2 HOUSING UNITS Total housing units 28,522 100.0 Occupied housing units 25,351 88.9 Vacant housing units 3,171 11.1
Source: U.S. Census Bureau, 2010 Census.
Total18 years and over NumberPercentNumberPercent Total population 30,961 100.0 22,197 100.0 2000 population 20,065
14,396
Increase 10,896 54.3 7,801 54.2 RACE One race 30,106 97.2 21,795 98.2 White 11,144 36.0 8,956 40.3 Black or African American 17,297 55.9 11,696 52.7 American Indian and Alaska Native 70 0.2 58 0.3 Asian 559 1.8 435 2.0 Native Hawaiian and Other Pacific Islander 18 0.1 13 0.1 Some Other Race 1,018 3.3 637 2.9 Two or More Races 855 2.8 402 1.8 HISPANIC OR LATINO AND RACE Hispanic or Latino (of any race) 2,243 7.2 1,382 6.2 Not Hispanic or Latino 28,718 92.8 20,815 93.8 One race 28,071 90.7 20,517 92.4 White 10,331 33.4 8,436 38.0 Black or African American 17,031 55.0 11,540 52.0 American Indian and Alaska Native 65 0.2 56 0.3 Asian 554 1.8 432 1.9 Native Hawaiian and Other Pacific Islander 15 0.0 10 0.0 Some Other Race 75 0.2 43 0.2 Two or More Races 647 2.1 298 1.3 HOUSING UNITS Total housing units 13,163 100.0 Occupied housing units 11,627 88.3 Vacant housing units 1,536 11.7
Source: U.S. Census Bureau, 2010 Census.
Douglas County Population
Total18 years and over NumberPercentNumberPercent Total population 132,403 100.0 94,870 100.0 2000 population 92,174
66,739
Increase 40,229 43.6 28,131 42.2 RACE One race 129,246 97.6 93,416 98.5 White 69,458 52.5 53,745 56.7 Black or African American 52,290 39.5 34,803 36.7 American Indian and Alaska Native 399 0.3 312 0.3 Asian 1,904 1.4 1,446 1.5 Native Hawaiian and Other Pacific Islander 137 0.1 86 0.1 Some Other Race 5,058 3.8 3,024 3.2 Two or More Races 3,157 2.4 1,454 1.5 HISPANIC OR LATINO AND RACE Hispanic or Latino (of any race) 11,125 8.4 6,581 6.9 Not Hispanic or Latino 121,278 91.6 88,289 93.1 One race 118,950 89.8 87,250 92.0 White 64,911 49.0 51,014 53.8 Black or African American 51,387 38.8 34,310 36.2 American Indian and Alaska Native 321 0.2 260 0.3 Asian 1,876 1.4 1,426 1.5 Native Hawaiian and Other Pacific Islander 128 0.1 78 0.1 Some Other Race 327 0.2 162 0.2 Two or More Races 2,328 1.8 1,039 1.1 HOUSING UNITS Total housing units 51,672 100.0 Occupied housing units 46,624 90.2 Vacant housing units 5,048 9.8
Source: U.S. Census Bureau, 2010 Census.
Georgia Population
Total18 years and over NumberPercentNumberPercent Total population 9,687,653 100.0 7,196,101 100.0 2000 population 8,186,453
6,017,219
Increase 1,501,200 18.3 1,178,882 19.6 RACE One race 9,480,164 97.9 7,089,529 98.5 White 5,787,440 59.7 4,481,721 62.3 Black or African American 2,950,435 30.5 2,097,470 29.1 American Indian and Alaska Native 32,151 0.3 23,053 0.3 Asian 314,467 3.2 236,031 3.3 Native Hawaiian and Other Pacific Islander 6,799 0.1 4,751 0.1 Some Other Race 388,872 4.0 246,503 3.4 Two or More Races 207,489 2.1 106,572 1.5 HISPANIC OR LATINO AND RACE Hispanic or Latino (of any race) 853,689 8.8 539,002 7.5 Not Hispanic or Latino 8,833,964 91.2 6,657,099 92.5 One race 8,681,984 89.6 6,579,754 91.4 White 5,413,920 55.9 4,242,514 59.0 Black or African American 2,910,800 30.0 2,072,946 28.8 American Indian and Alaska Native 21,279 0.2 16,324 0.2 Asian 311,692 3.2 234,164 3.3 Native Hawaiian and Other Pacific Islander 5,152 0.1 3,699 0.1 Some Other Race 19,141 0.2 10,107 0.1 Two or More Races 151,980 1.6 77,345 1.1 HOUSING UNITS Total housing units 4,088,801 100.0 Occupied housing units 3,585,584 87.7 Vacant housing units 503,217 12.3
Source: U.S. Census Bureau, 2010 Census.