Schools
School Report Card: How Clark and Garwood Stack Up
The Department of Education released the school report cards on Tuesday.

The Department of Education has released the 2009-2010 school report card data. Here are the numbers for Clark and Garwood school districts.
Administrator Years of Experience and Salary
CLARK: Clark's median administrator salary rose 10 percent from 2008-2009 to 2009-2010 to $119,000, which is slightly higher than the state median of $117,895. The median numbers of years of experience in Clark (14) is lower than the state median (20) by six years.
Find out what's happening in Clark-Garwoodfor free with the latest updates from Patch.
GARWOOD: Garwood's median administrator salary rose just $838 from 2008-2009 to 2009-2010 to $89,320. That number is $28,575 lower than the state median of $117,895. The median numbers of years of experience in Garwood (16) is also lower than the state median (20) by four years.
Town Name Median Years of Experience 2008-2009Median Salary 2008-2009 Median Years of Experience 2009-2010 Median Salary 2009-2010
State Average
Find out what's happening in Clark-Garwoodfor free with the latest updates from Patch.
(for district's with a high school)
21 $114,950 20 $117,895 Berkeley Heights 16 $121,195 16$126,028 Clark 15
$108,000 14 $119,000 Cranford 23
$115,130 24 $125,000 Elizabeth 18
$109,690 17 $107,594 Garwood 17
$88,482 16 $89,320 Hillside 26
$103,755 27 $107,245 Kenilworth 28
$118,664 21 $122,224 Linden 29
$119,805 23 $123,031 Mountainside 14
$117,000 15 $122,031 New Providence 11
$121,128 12 $126,215 Plainfield 15
$116,000 16 $124,150 Rahway 17
$108,622 17 $114,907 Roselle 13
$93,956 10 $93,956 Roselle Park 24 $104,138 25 $107,375 Scotch Plains 24
$129,668 16 $129,668 Springfield 16
$115,494 17 $115,379 Summit 28
$130,625 23 $134,768 Union County Vocational 16
$98,584 17 $101,413 Union 21
$114,950 22 $118,950 Westfield 21
$118,884 26 $127,656 Winfield 23
$95,760 24 $99,591
Faculty Years Experience and Median Salary
CLARK: The median number of years of experience of Clark's faculty remained the same as 2008-2009 (9) and just a year below the state median (10). However, the median faculty salary rose $1,892, or 3.6 percent, to $54,365 in 2009-2010. The median salary is $7,475 lower than the state median of $61,840.
GARWOOD: The median number of years of experience of Garwood's faculty decreased by two years from 2008-2009 (12) to 2009-2010 (10) and is now the same as the state median of 10 years. The median faculty salary decreased $1,248 or 2.4 percent, to $51,773 in 2009-2010. The median salary is $10,067 lower than the state median of $61,840.
Median Salary 2008-2009 Median Years of Experience 2009-2010 Median Salary 2009-2010 State Average 9 $59,545 10 $61,840 Berkeley Heights 9
$61,623 10 $61,602 Clark 9
$52,473 9 $54,365 Cranford 9
$58,571 9 $57,903 Elizabeth 8
$59,979 9 $63,239 Garwood 12
$53,021 10 $51,773 Hillside 8
$60,067 8 $62,740 Kenilworth 8
$61,170 9 $64,377 Linden 8
$56,773 9 $59,204 Mountainside 9
$54,592 10 $57,032 New Providence 9
$62,276 10 $65,112 Plainfield 12
$70,470 13 $70,970 Rahway 8
$57,069 8 $59,959 Roselle 7
$50,401 5 $52,347 Roselle Park 8
$57,347 8 $55,988 Scotch Plains 8
$59,765 9 $60,368 Springfield 8
$63,306 9 $66,251 Summit 10
$60,752 10 $66,289 Union County Vocational 4
$53,537 5 $54,317 Union 8
$61,586 8 $64,045 Westfield 9
$62,639 10 $65,230 Winfield 11
$50,579 12 $52,603
Cost per pupil
There are two ways of calculating per pupil expenditures, a comparative cost per pupil which represents a comparison with districts with similar budget types, and a raw cost per pupil figure.
CLARK: Clark's cost per pupil is $1,991 lower than the state average. The comparative cost per pupil in Clark is $12,158, which is $1,675 lower than the state average of $13,833.
GARWOOD: Garwood's cost per pupil is $785 lower than the state average. The comparative cost per pupil in Garwood is $10,868, which is $2,965 lower than the state average of $13,833.
Town Name Cost per pupil 2008-2009Comparative cost per pupil 2008-2009
Cost per pupil 2009-2010 Comparative cost per pupil 2009-2010 State average $15,221 $12,983 $15,538 $13,833 Berkeley Heights $14,664 $15,168 $14,907 $13,425 Clark $12,919 $11,430 $13,547 $12,158 Cranford $13,565 $12,646 $13,810 $12,831 Elizabeth $16,600 $15,217 $17,507 $16,242 Garwood $11,843 $11,217 $14,753 $10,868 Hillside $14,677 $12,510 $14,954 $12,950 Kenilworth $13,795 $12,163 $14,861 $13,145 Linden $16,129 $12,936 $16,469 $13,174 Mountainside $14,866 $12,860 $14,276 $12,409 New Providence $14,217 $12,960 $14,590 $13,245 Plainfield $15,308 $17,739 $14,710 $15,553 Rahway $13,672 $12,050 $14,428 $12,682 Roselle $16,775 $13,398 $17,730 $14,100 Roselle Park $13,876 $13,005 $14,436 $13,453 Scotch Plains $13,759 $11,973 $13,711 $11,975 Springfield $15,766 $13,698 $15,670 $13,685 Summit $15,003 $13,753 $15,729 $14,411 Union County Vocational $13,405 $12,243 $12,974 $12,194 Union $14,769 $11,859 $15,532 $12,364 Westfield $13,220 $11,781 $13,553 $12,009 Winfield $18,907 $18,151 $19,208 $18,371
Revenue
CLARK: Clark's revenue sources remained the same in 2009-2010 with funds from the local tax levy making up 79 percent of the school's budget in 2009-2010.
GARWOOD: Garwood's revenue sources changed slightly in 2009-2010 with funds from the local tax levy making up 76 percent of the school's budget in 2009-2010, as opposed to 80 percent in 2008-2009.
Town Name 2008-2009 Revenue from Local Source2009-2010 Revenue from Local Source State average 50% 51% Berkeley Heights 79% 80% Clark 79%
79% Cranford 84%
84% Elizabeth 11%
11% Garwood 80%
76% Hillside 51%
50% Kenilworth 74%
74% Linden 68%
68% Mountainside 77%
84% New Providence 88%
89% Plainfield 13%
14% Rahway 59%
59% Roselle 46%
44% Roselle Park 60%
60% Scotch Plains 90%
91% Springfield 91%
91% Summit 91%
93% Union County Vocational 21%
21% Union 54%
59% Westfield 89%
90% Winfield 45% 45%
Enrollment and class sizes
Enrollment numbers are based on students "on roll" as of October 2009.
CLARK: Overall, the district had 2,299 students in 2009-2010. This number is down just slightly from an enrollment of 2,306.5 in 2008-2008.
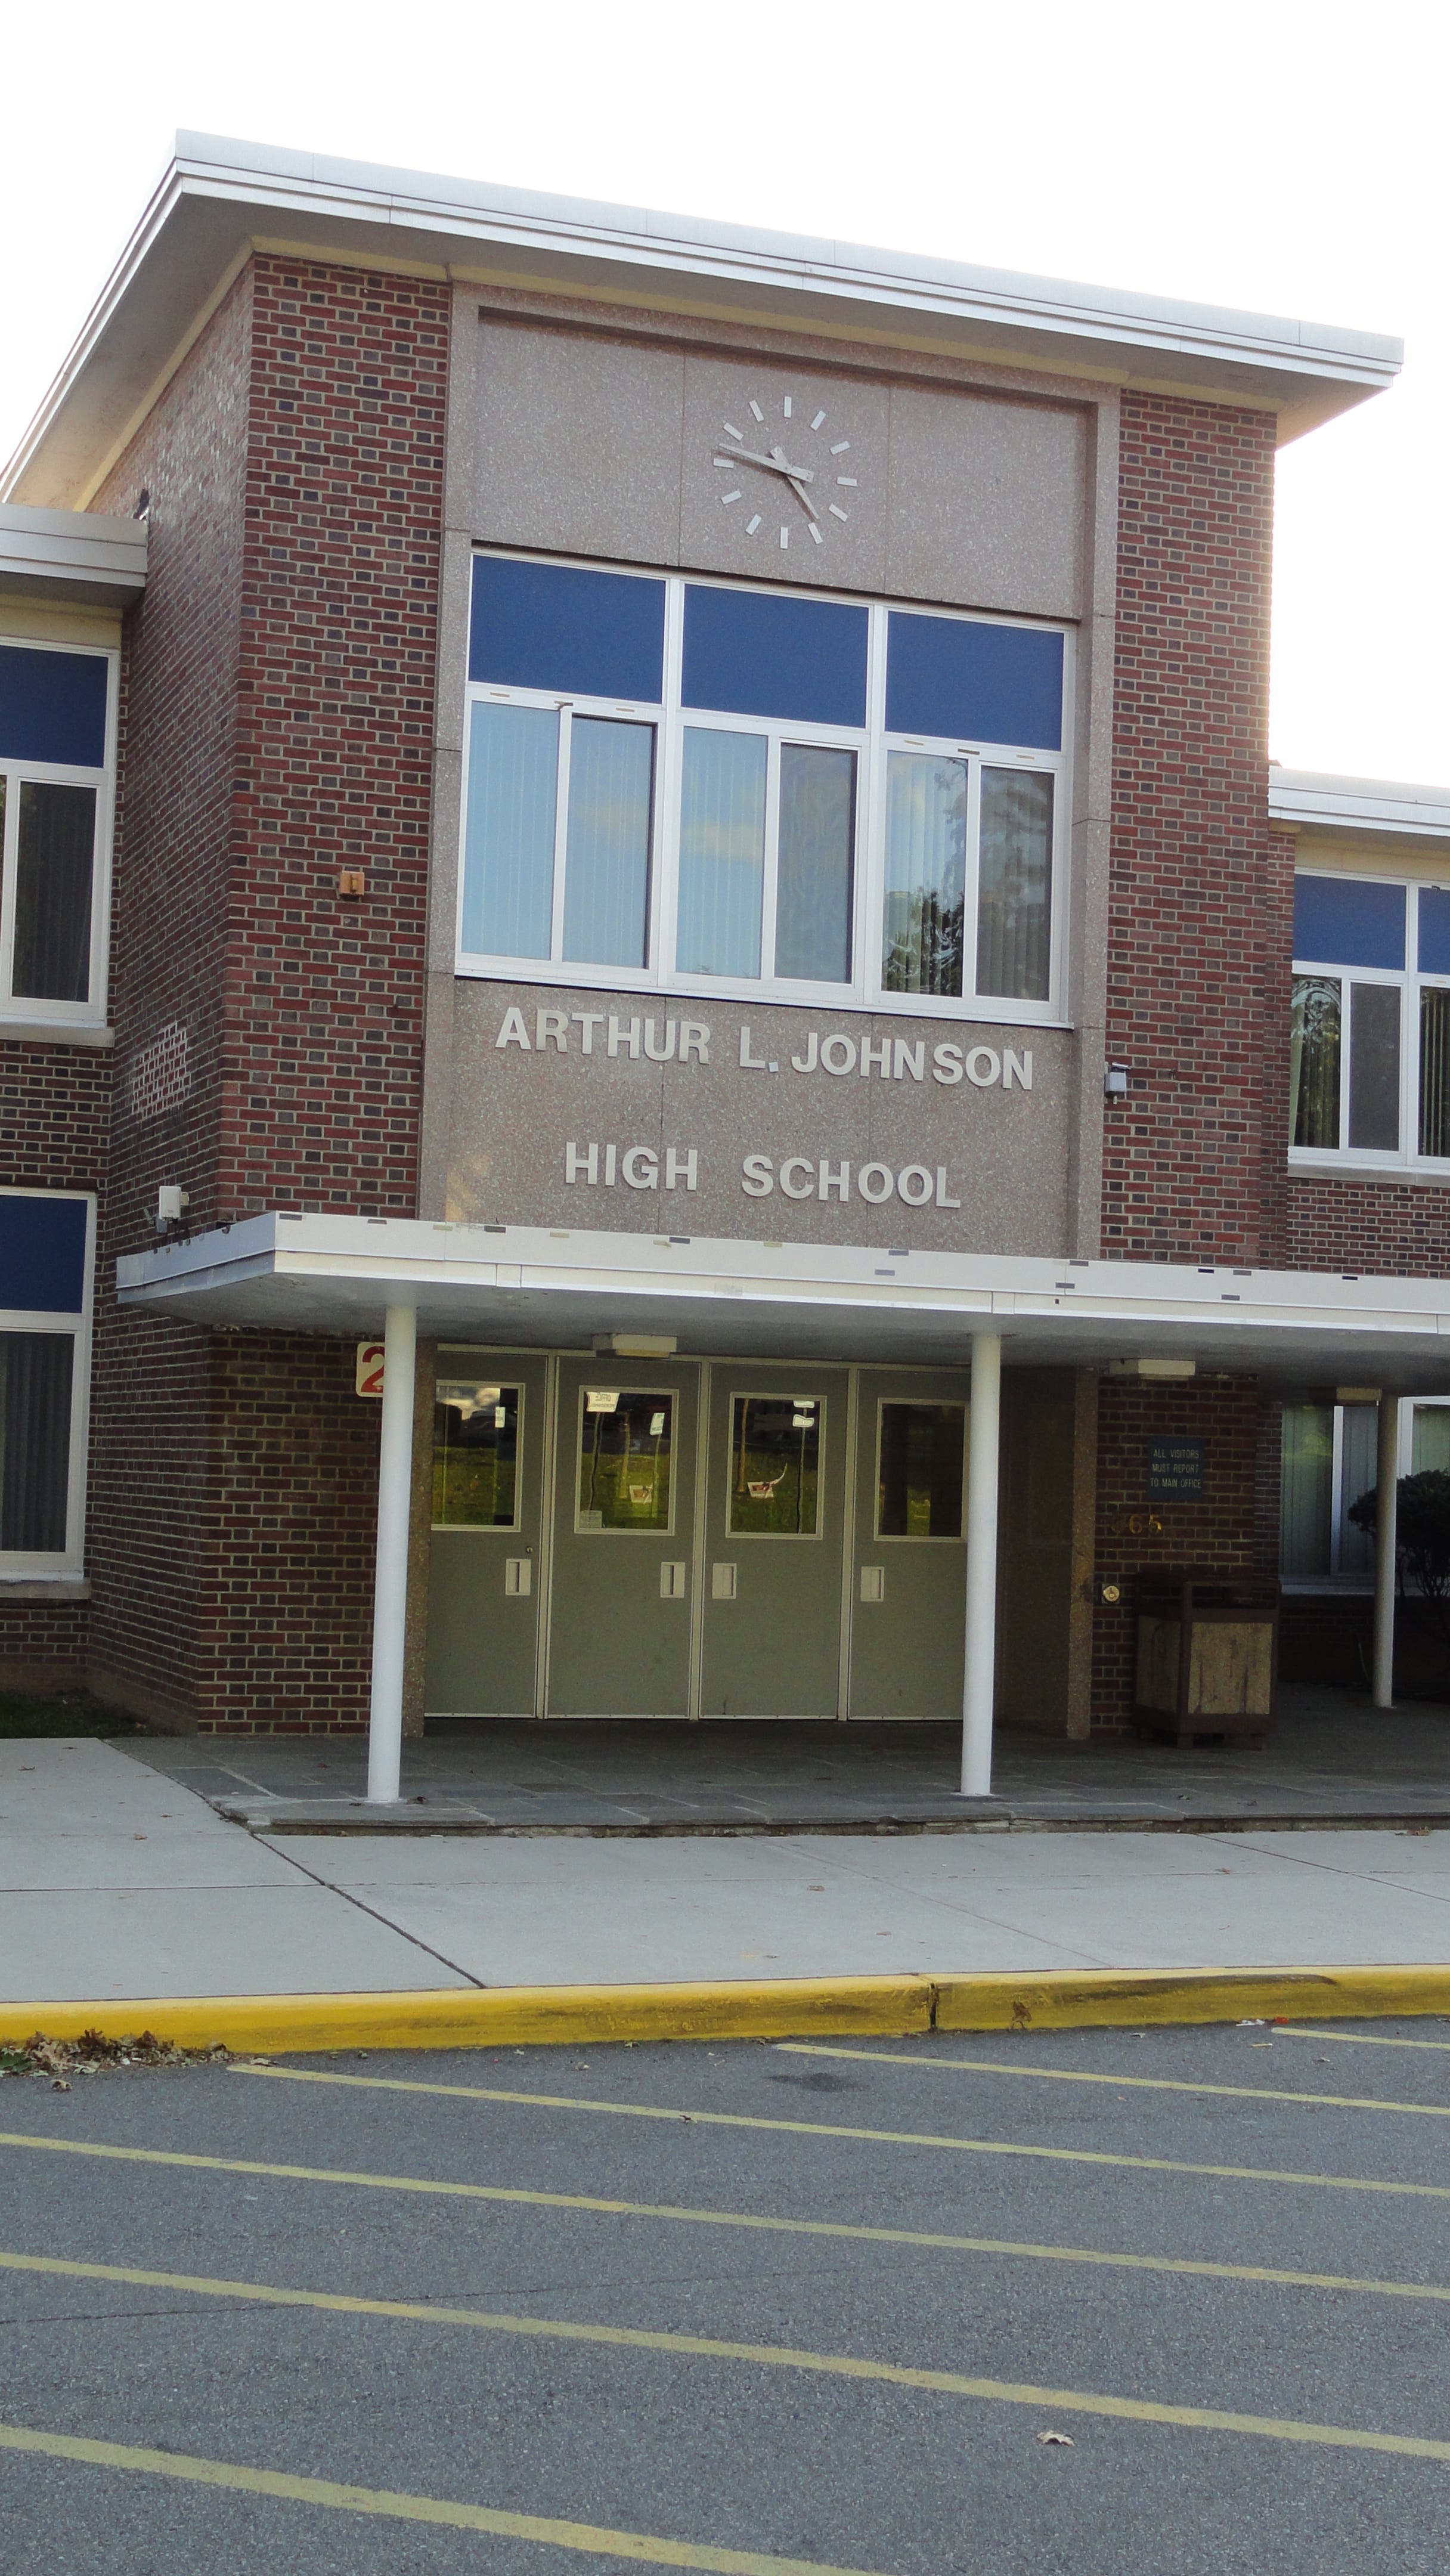
- Arthur L. Johnson High School: Enrollment decreased in 2009-2010 to 811 students from 826.5 students in 2008-2009, 832.5 students in 2007-2008 and 844 students in 2006-2007. From 2006-2007 to 2009-2010, enrollment decreased by 4 percent. Average class size at Johnson is 17.25. That state average class size for grades 9-12 is 19.65.
- Carl H. Kumpf Middle School: Enrollment at Kumpf was 544 students, down 7 students since 2008-2009 when enrollment was 551 students. The average class size at Kumpf is below the state average (16.5 compared to the state average of 18.2 for grades 6, 7 and 8).
- Frank K. Hehnly Elementary School: Enrollment as Hehnly is up 4 students from 2008-2009 to 2009-2010. Class sizes are above the state average. (21.5 compared to the state average of 18.2 for grades K-5.)
- Valley Road Elementary School: Enrollment at Valley Road is up 11 students from 2008-2009 to 2009-2010. Class sizes are just slightly above the state average. (19.4 compared to the state average of 18.2 for grades K-5).
GARWOOD:
- Lincoln School had 325 students in 2009-2010. That number is down six students from 2008-2009. Class sizes are just slightly above the state average. (19.2 compared to the state average of 18.2 for grades 1-8.)
Test scores
- HSPA, Language Arts Literacy: The number of students receiving advanced proficient rose to 16.9 percent from 16.1 percent in 2008-2009.
- HSPA, Mathematics: The number of students receiving advanced proficient rose to 20 percent from 18 percent in 2008-2009 .
- AP Tests: Of the 278 students taking AP tests, 180 scored a 3 or better.
Get more local news delivered straight to your inbox. Sign up for free Patch newsletters and alerts.