Health & Fitness
Blog Post: How Is Vienna's Real Estate Market Faring?
Time flies and we are (more than) halfway through 2012. Here's a mid-year update.



Time flies and we are (more than) halfway through 2012. So how is the Vienna real estate market faring? Instead of updating you on what has happened in the past week like we usually do, let’s pause and take a look back to the year 2000 and see where Vienna stands in terms of number of home sales, average selling price and average days on market.
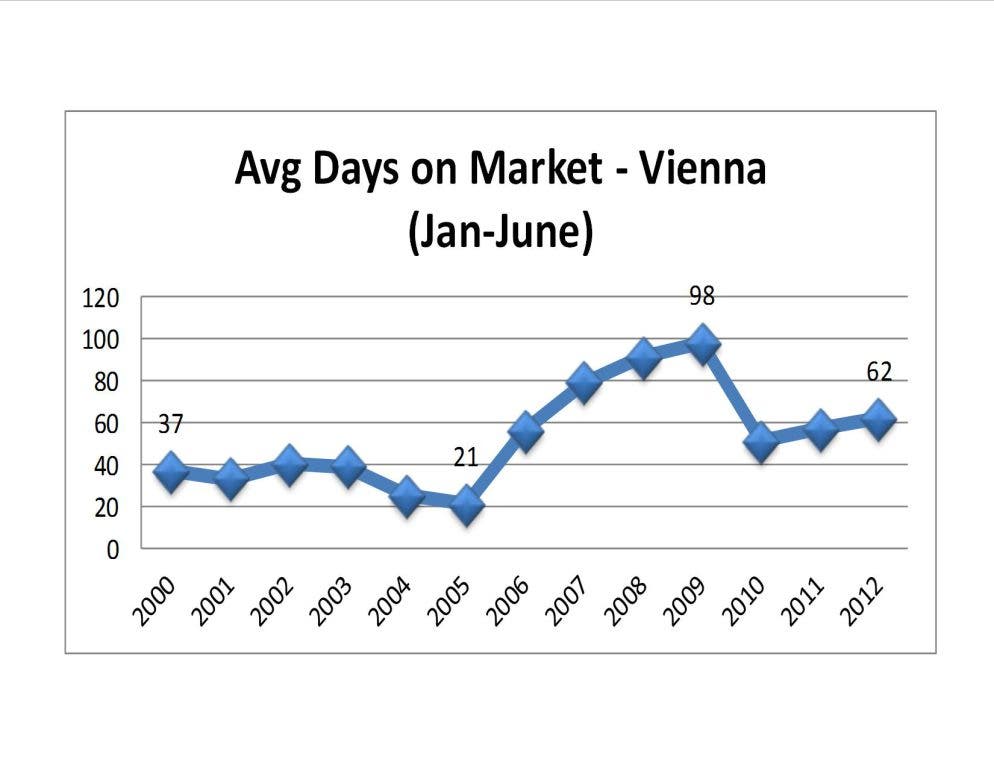
The charts above show a year-over-year comparison for January through June for each year from 2000 through 2012. What do we see?
Average days on market for homes sold in Vienna for the first half of 2012 was 62 days – just about two months. Back in 2000, average days on market was at 37 days. It dropped to 21 days in 2005 at the peak of the market; and then spiked to 98 days in 2009. The last three years show much more “normal” time frames of 51-61 days. So it looks like we’re back in balance in terms of how long it takes to sell a home.
Find out what's happening in Viennafor free with the latest updates from Patch.
Total number of sales in the first half of 2000 was 519. This year, we have had 435 homes sold through the end of June – up from last year at this time when only 364 homes had sold. If you’ve been following our blog on a weekly basis, this is no surprise. You know that inventory has been VERY low in Vienna over the past few years. (Note to Sellers – It’s still a GREAT time to sell. Low inventory puts YOU in the driver’s seat).
The good news is that although the number of sales has trended downward, the average sales price has trended upward. In the year 2000, the average sales price for the first half of the year was $358,557. This year, the average sales price for January-June was $694,237. While we are not yet at the price levels we saw at the height of the market in 2006, average sales price has trended upward for three straight years in a row (8%, 2% & 5% in 2010, 2011 & 2012.)
Find out what's happening in Viennafor free with the latest updates from Patch.
(Note that average sales price increased year-over-year for each year from 2000 through 2006. Prices fell from 2007 through 2009. And then average sales price headed back up in 2010, 2011 & 2012.)
Next Wednesday, we’ll be back to our usual weekly Vienna update. In the meantime, read The Belt Team for more information.