Weather
OC Walloped By Torrential Storm: See Local Rain and SoCal Snowfall Totals
The two-day storm was pushed out by howling winds early Wednesday. See how much it rained in your area.

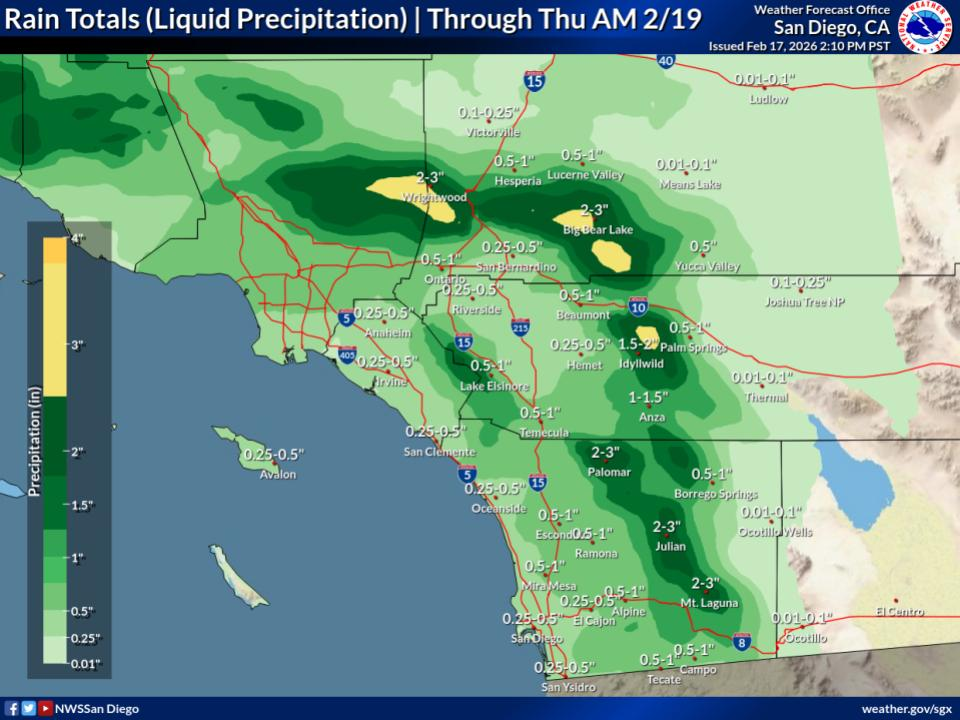
ORANGE COUNTY, CA — A drenching winter storm swept across Southern California with torrential downpours dropping nearly nine inches of rain — nearly a month's worth of rain in three days, according to the National Weather Service rainfall totals.
The top rainfall in Southern California was recorded in San Bernardino County's Lytle Creek area, with 8.68 inches of rain, followed by Lake Cuyamaca with 5.89 inches, and Mount Baldy with 5.31 inches.
Overnight, in Los Angeles and coastal areas, roads flooded as drainage systems became waterlogged, with 2.5 inches of rain hammering some areas. Emergency responders attempted to rescue a driver trapped on the roof of his truck in an Inland Empire flood. Elsewhere, downed trees and power lines caused problems for residents. In Riverside County, high winds toppled trailers and ripped awnings from structures, according to reports.
Find out what's happening in Orange Countyfor free with the latest updates from Patch.
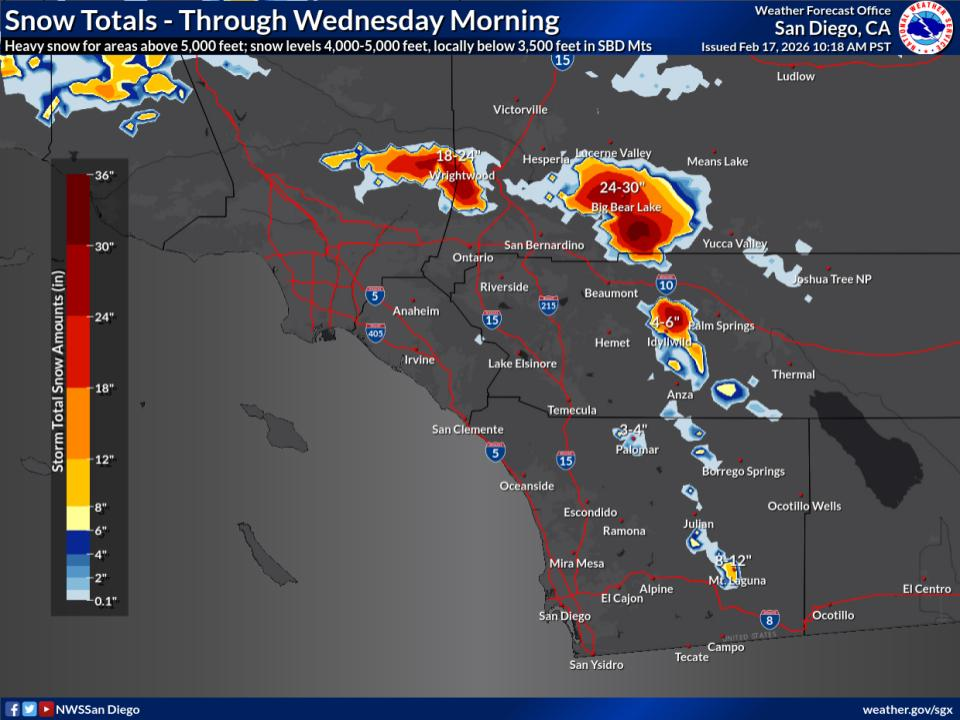
Snow blanketed higher elevations. Between 28 and 38 inches fell at Mountain High between 6,600 and 8000 feet, 18-36 inches fell at Bear Mountain and Snow Summit, and 12 to 24 inches fell at Snow Valley. Big Bear saw 28 inches in the city at 6,800 feet, while Lake Arrowhead received 9 inches of snow, at the 5,400-foot elevation. More now is expected in the mountains.
"Snow levels are likely to reach 4,000 feet Thursday through Friday, with some accumulation, even on the I-5 Grapevine, according to the NWS. Saturday will have the best SoCal weather, with temperatures in the mid-60s, with another, weaker storm system slated to arrive early next week.
Find out what's happening in Orange Countyfor free with the latest updates from Patch.
According to the National Weather Service, the official rainfall totals for Los Angeles, Orange, San Diego and Riverside Counties were as follows:
LA County Coast & Metro
| City / Station | 72-Hour Rainfall (inches) |
|---|---|
| Bel Air | 3.38 |
| Beverly Hills | 2.98 |
| Hollywood Reservoir | 2.64 |
| Los Angeles Downtown | 2.54 |
| Santa Monica (KSMO) | 2.35 |
| Los Angeles Airport (KLAX) | 2.22 |
| Culver City | 2.10 |
| Hawthorne (KHHR) | 2.04 |
| Long Beach (KLGB) | 1.99 |
| Leo Carrillo | 1.96 |
LA County San Fernando Valley
| Agoura Hills | 3.54 |
| Porter Ranch RAWS | 3.43 |
| Canoga Park | 3.42 |
| Calabasas | 3.25 |
| La Cañada Flintridge | 3.10 |
| Hansen Dam | 2.93 |
| Van Nuys (KVNY) | 2.85 |
| Chatsworth Reservoir | 2.85 |
| Northridge | 2.74 |
| San Rafael Hills | 2.66 |
| Burbank (KBUR) | 2.21 |
| Woodland Hills | 1.56 |
LA County San Gabriel Valley
| Morris Dam | 3.57 |
| Mt Olive High School | 2.83 |
| Claremont | 2.80 |
| Alhambra | 2.78 |
| Eagle Rock Reservoir | 2.64 |
| Santa Fe Dam | 2.60 |
| La Verne | 2.44 |
| Whittier | 2.28 |
| East Pasadena | 2.15 |
| Sierra Madre | 2.04 |
LA County Santa Clarita Valley
| Newhall | 2.83 |
| Castaic Junction | 2.40 |
| Del Valle | 2.37 |
| Castaic | 1.89 |
| Saugus | 1.48 |
LA County Catalina Island
| Catalina Island RAWS | 1.60 |
LA County Mountains
| San Antonio Sierra PH | 6.79 |
| West Fork Heliport | 5.90 |
| Cogswell Dam | 5.83 |
| Mt Baldy | 5.31 |
| San Gabriel Dam | 4.37 |
| Tanbark | 3.74 |
| Pacoima Dam | 3.11 |
| Warm Springs Camp | 3.05 |
| Big Dalton Dam | 2.83 |
| Camp 9 | 2.70 |
| Santa Anita Dam | 2.52 |
| Whitaker Peak | 2.42 |
| Crystal Lake | 2.40 |
| Warm Springs | 2.37 |
| Chilao South | 2.05 |
| Hungry Valley | 1.89 |
| Mount Wilson | 1.86 |
| Sandberg (KSDB) | 1.78 |
| Chilao | 1.61 |
| Mill Creek | 1.20 |
| San Antonio Dam | 0.48 |
Orange County
Orange County Coastal Areas
| City / Station | 72-Hour Rainfall (inches) |
|---|---|
| Fullerton Airport | 1.69 |
| Orange County Reservoir | 1.68 |
| Aliso Laguna RAWS | 1.53 |
| Bell Canyon | 1.45 |
| Carbon Canyon Dam | 1.25 |
| Fullerton Dam | 1.16 |
| Laguna Beach | 1.00 |
| John Wayne Airport | 0.96 |
Santa Ana Mountains
| City / Station | 72-Hour Rainfall (inches) |
|---|---|
| Leach/Dickey Canyon | 4.17 |
| Coldwater Canyon | 4.14 |
| Horsethief/Rice Canyon | 4.01 |
| Indian Canyon | 3.59 |
| McVicker Canyon | 3.27 |
| Santa Rosa Plateau | 2.60 |
| El Cariso RAWS | 2.11 |
| Fremont Canyon RAWS | 1.81 |
San Diego County
| City / Station | Precipitation (inches) |
|---|---|
| Kearny Mesa | 1.86 |
| Miramar | 1.74 |
| Carlsbad | 1.70 |
| Carlsbad Airport | 1.61 |
| San Marcos Landfill | 1.61 |
| Brown Field | 1.57 |
| El Camino Del Norte | 1.51 |
| Camp Pendleton – Lake O’Neill | 1.50 |
| Fashion Valley | 1.39 |
| Vista | 1.38 |
| San Onofre | 1.36 |
| Las Flores RAWS | 1.35 |
| Montgomery Field | 1.23 |
| San Diego International Airport | 1.16 |
| National City | 1.14 |
| Point Loma | 1.03 |
| Oceanside | 1.01 |
| Chula Vista | 1.00 |
| North Island NAS | 0.75 |
Riverside County/Inland Empire Rainfall Report
| City / Station | Precipitation (inches) |
|---|---|
| Temescal FS Guard Station | 3.31 |
| Prado Dam | 2.33 |
| Beaumont RAWS | 2.13 |
| Cabazon RAWS | 1.98 |
| North Elsinore | 1.93 |
| Temecula | 1.93 |
| Cranston RAWS | 1.88 |
| Beaumont | 1.81 |
| Lake Matthews RAWS | 1.79 |
| Murrieta Creek at Tenaja | 1.73 |
| Potrero Canyon | 1.61 |
| Pigeon Pass Dam | 1.54 |
| Riverside South | 1.49 |
| Clark RAWS | 1.47 |
| Woodcrest Dam | 1.38 |
| San Jacinto North | 1.38 |
| Skinner Lake | 1.34 |
| Moreno-Clark | 1.33 |
| French Valley Airport | 1.24 |
| Riverside Airport | 1.23 |
| Norco | 1.14 |
| Lake Matthews | 1.12 |
| Riverside - March ARB | 1.10 |
Get more local news delivered straight to your inbox. Sign up for free Patch newsletters and alerts.