Politics & Government
Gallup Says-'2024 Election Environment Favorable to GOP'-Election Time
Election Time on New York Times/Siena Survey other polls outline possible Electoral College path for Kamala Harris (D) & Donald J. Trump (R)

According to the "Bottom Line" from Gallup's media release on their latest 2024 polling said: "The political environment suggests the election is Trump’s and Republicans’ to lose." That is debatable, but interesting. This article will provide insights from Election Time (ET), Gallup, and the Daily Torch in that order (Parts I, II, III) and my personal wrap up. But I'd preview my thoughts like this. While on paper ET, Gallup have a point, I'd say that the advantages tend to be on the left or Kamala Harris' (D) side over the 45th President Donald J. Trump (R). Either one might win.
Part I
Find out what's happening in Lakelandfor free with the latest updates from Patch.
Part II - According to Gallup 9.24.2024
Find out what's happening in Lakelandfor free with the latest updates from Patch.
Party affiliation, GOP issue advantages, economic pessimism among key factors
by Jeffrey M. Jones
WASHINGTON, D.C. -- Nearly all Gallup measures that have shown some relationship to past presidential election outcomes or that speak to current perceptions of the two major parties favor the Republican Party over the Democratic Party. Chief among these are Republican advantages in U.S. adults’ party identification and leanings, the belief that the GOP rather than the Democratic Party is better able to handle the most important problem facing the country, Americans’ dissatisfaction with the state of the nation, and negative evaluations of the economy with a Democratic administration in office.

The following is a review of these key measures in 2024, primarily from a Sept. 3-15 Gallup poll, compared with the same measures in past presidential election years.
Party Identification and Leaning
More U.S. adults identify as Republican or say they lean toward the Republican Party (48%) than identify as or lean Democratic (45%). Those figures are based on an average of Gallup polls taken during the third quarter (July to September) to minimize poll-to-poll variation in party identification estimates and to provide more reliable comparisons across presidential years given the different timings of the two major party conventions in July, August or September.
Party affiliation and voting are strongly predictive of individuals’ vote choices, with the vast majority of identifiers and leaners voting for the candidate of their preferred party. At the aggregate level, there are typically more Democrats and Democratic leaners than Republicans and Republican leaners in the U.S. adult population. Democrats have won presidential elections in years in which they had larger-than-normal advantages in party affiliation, including 1992, 1996, 2008, 2012 and 2020.
In years when the advantage was narrower -- 2004 and 2016, for example -- Republicans won in the electoral college if not also the popular vote.
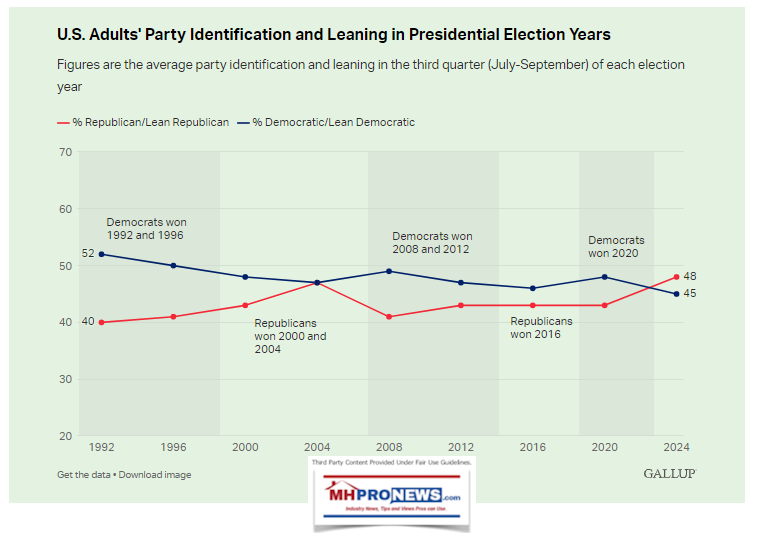
Republicans previously have not had an outright advantage in party affiliation during the third quarter of a presidential election year, and they have rarely outnumbered Democrats in election and nonelection years over the past three decades.
Party Performance on Issues
Three separate measures of party performance on issues favor the Republican Party by at least a modest margin.
By 46% to 41%, Americans say the Republican Party is better able than the Democratic Party to address what they think is the most important problem facing the country. The top issues Americans currently name as the most important are ones that tend to favor the GOP, including the economy (24%), immigration (22%), the government (17%) and inflation (15%).
This measure has been highly predictive of election outcomes in Gallup trends dating back to 1948. The party rated as better at handling the most important problem has won all but three presidential elections since that year. The question was not asked in 2000, and the two parties tied in 1980, when inflation was the top issue. The only time the measure was out of sync with the outcome was in 1948, when Americans believed the Republican Party was better able to handle the most important problem (international issues) but returned Democratic incumbent Harry Truman to office.

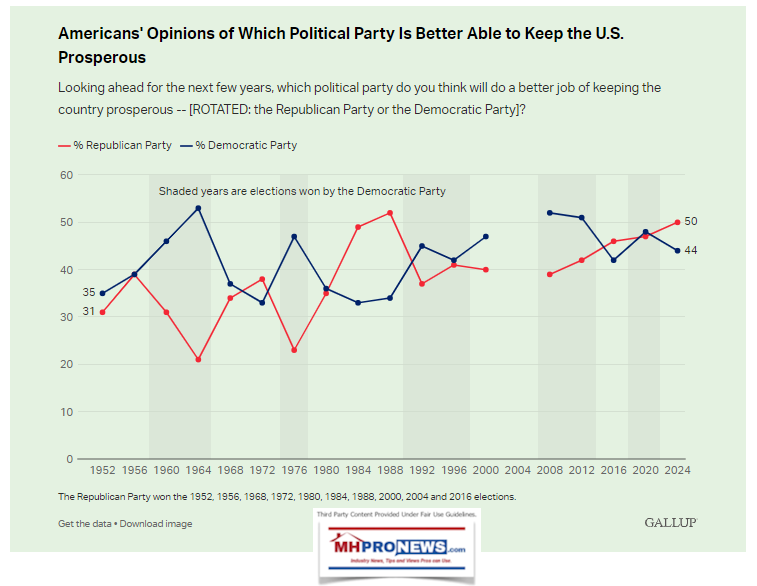
Gallup also tracks perceptions of which party can best handle economic and international matters, broadly. Americans currently give the Republican Party a six-percentage-point edge, 50% to 44%, as the party they think would do a better job of keeping the country prosperous. Gallup has asked this question since 1951. In 16 presidential elections since then when one party has had at least a minimal advantage on this measure, that party has won 12 times. The exceptions were 1952, 1968, 1980 and 2000. The question was not asked in 2004, and the parties were tied in 1956.
Republicans hold a more substantial advantage of 14 points (54% to 40%) as the party Americans believe is better able to keep the nation safe from terrorism and other international threats. Republicans have led on this question all years it has been asked (dating back to 2002) except 2007 and 2012.
Gallup has a limited history of asking this question in presidential election years. The 14-point Republican lead this year is larger than in any previous presidential election year. The prior highs were seven points in 2008 (a year Republicans lost) and 2016 (a year Republicans won). In 2012 (when the parties were tied) and 2020 (when Republicans had a four-point advantage), the Democratic candidate won the presidential election.
Economic Confidence
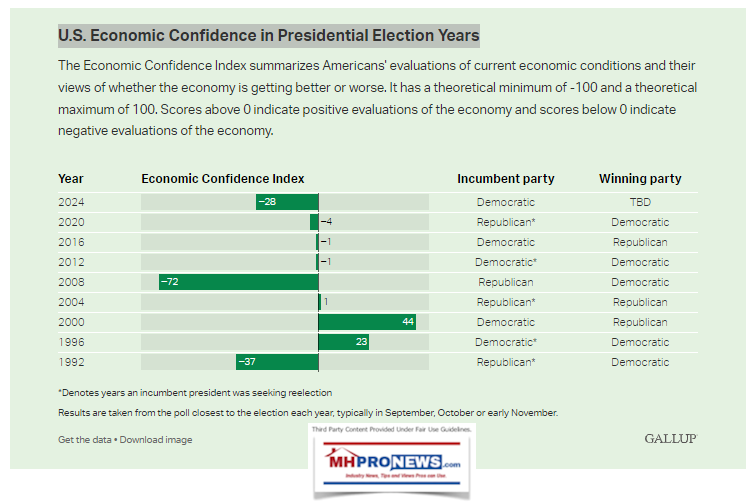
Gallup’s Economic Confidence Index is currently at -28, indicating Americans’ attitudes about the economy are negative, on balance. The rating is derived from the 22% of Americans describing current economic conditions as “excellent” or “good” versus the 48% saying they are “poor,” and the 32% believing the economy is “getting better” versus the 62% saying it is “getting worse.”
In incumbent election years, a -28 economic confidence score would be closer to what it has typically been in losing (1992, 2008, 2016) rather than winning (1996, 2004, 2012) years for the president’s party. In 2020, Americans’ evaluations were essentially neutral when Donald Trump lost, though other incumbent presidents won when there were similar levels of economic confidence.
National Satisfaction
Twenty-two percent of Americans are satisfied with the way things are going in the United States at this time. Satisfaction levels this low have been associated with incumbent presidents losing their reelection bids in 1980 (19%), 1992 (22%) and 2020 (28%).
In election years when incumbents have not sought reelection, satisfaction has been less strongly related to the eventual outcome. The 1988 and 2008 elections followed the general pattern, with the president’s party winning the former when the majority of Americans were satisfied and losing the latter with satisfaction near record lows. However, in 2000, Americans were highly satisfied, but the incumbent Democratic Party lost a close election in the Electoral College. The incumbent Democratic Party also lost the 2016 election (also in the Electoral College) with more middling levels of satisfaction.

Presidential Job Approval
President Joe Biden’s decision to withdraw from the 2024 presidential race has moved presidential job approval from arguably the most important election indicator this year to one of secondary importance. At 39% job approval, Biden is well below the 48% threshold for past presidents who were reelected. The 2024 Republican presidential nominee, Donald Trump, lost the 2020 election when 46% approved of the job he was doing as president.
Biden’s unpopularity could still affect the election to the extent voters transfer their frustrations with the Biden administration to Vice President Kamala Harris. For her part, 44% of U.S. adults approve of the job she is doing as vice president, down slightly from a 47% reading in August.
In presidential election years when the incumbent was not running for reelection, the opposition party won all but the 1988 election. These losses occurred whether the incumbent president was popular (1960, 2000 and 2016) or unpopular (1952, 1968 and 2008) at the time of the election. All of those elections, unlike the current one, came after the incumbent had been elected to serve a second term as president in the prior election.
Party Favorable Ratings
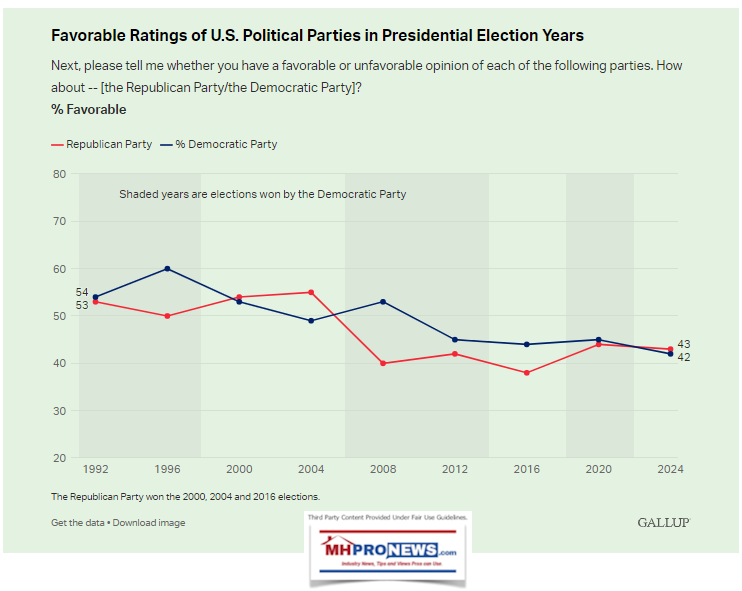
One area where the Republican Party does not have an advantage over the Democratic Party this year is in party favorable ratings. The September Gallup poll finds 43% of Americans saying they have a favorable opinion of the Republican Party and 42% of the Democratic Party.
In many presidential election years, like now, the parties had similar favorable ratings. In the years in which one party had an advantage -- 1996, 2004, 2008, 2012 and 2016 -- the party with the higher favorable rating won all but one (2016).
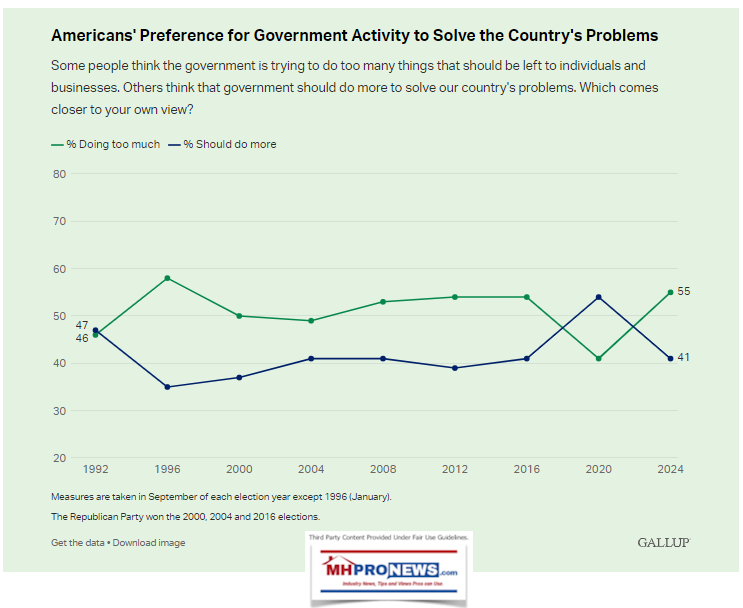
Preference for Government Activity
Americans generally express a preference for a limited government role, the traditional Republican position, when they are asked whether the government is doing too many things that should be left to individuals and businesses (55%) or should do more to solve the country’s problems (41%). Since opinions on this matter have been fairly consistent over time, they tend to have little relationship to election outcomes.
However, it is notable that in 1992 and 2020, the only two election years when more Americans preferred an active government role, the Democratic Party candidate defeated a Republican incumbent.
Congressional Job Approval
All seats in the House of Representatives and approximately one-third of U.S. Senate seats are up for election this year. Congress remains unpopular, with 20% approving and 75% disapproving of the job it is doing, which theoretically could make incumbent members of Congress vulnerable. To the extent Americans’ frustrations with Congress influence their vote decision, it is unclear how those numbers will translate because the Republicans have a majority in the House of Representatives and Democrats are the majority party in the Senate.
Nevertheless, the current level of congressional approval is remarkably similar to what it has been in every congressional election cycle since 2008, ranging between 18% and 21%.
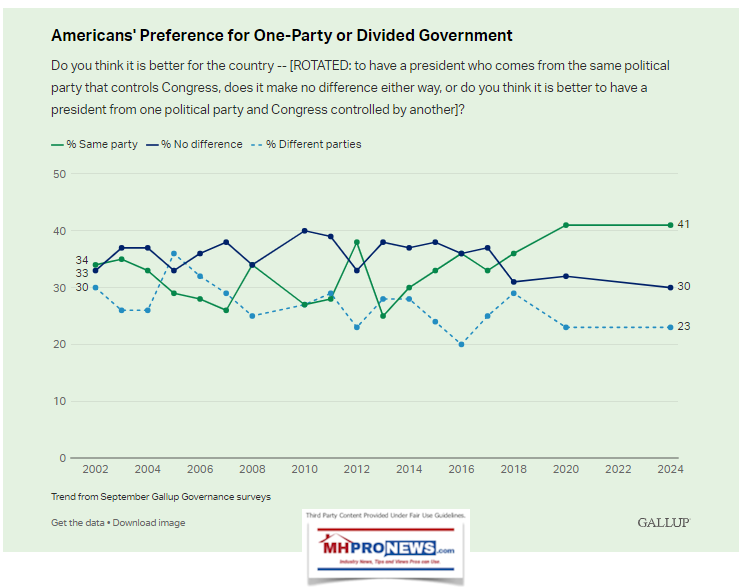
Divided Government Preference
Americans have typically not held a clear preference for having a unified versus divided party government. The 41% who this year say having the same party control Congress and the presidency ties with 2020 as the highest in Gallup’s trend. Thirty percent say it makes no difference whether the government is unified or divided, while 23% say having different parties control Congress and the presidency is preferable.
Americans have been slightly more likely to say that a unified government is better in presidential compared with non-presidential election years.
Bottom Line
The political environment suggests the election is Trump’s and Republicans’ to lose. Nearly every indicator of the election context is favorable to the Republican Party, and those that aren’t are essentially tied rather than showing a Democratic advantage. Nevertheless, the two major party presidential candidates have similar favorable ratings in Gallup’s September poll, echoing presidential preference polls that suggest a neck-and-neck race between Trump and Harris.
It is possible that Americans’ voter preferences may align better with their views of the state of the nation between now and Election Day. Trump led in most presidential preference polls this summer when Biden was the presumptive Democratic nominee and Americans’ unhappiness was focused on the incumbent president. The election results will reveal the extent to which Harris, the incumbent vice president, is saddled with Americans’ frustrations with the current administration or is able to rise above those.
It may be the case that Americans want to go in a different direction after previously voting against a second Trump term in 2020. If Trump were to lose, it suggests that concerns about his style, character, temperament, felony charges and convictions, and age outweigh Americans’ anxieties about the state of the nation. ##
Part III- According to the Daily Torch
NY Times-Siena poll shows national race tied between Trump and Harris, Trump leading gender gap, economy, immigration and Ukraine-Russia war
The latest New York Times-Siena poll taken Sept. 11 to Sept. 16 shows the national race between Vice President Kamala Harris and former President Donald Trump to be tied both in the two-candidate race, 47 percent to 47 percent, and in the multi-candidate poll including Jill Stein, Chase Oliver and Cornell West, 46 percent to 46 percent.
This was New York Times-Siena’s first poll after the Sept. 10 debate between the two candidates and the implication, once again, is that if the national race is tied, that means the national popular vote is in play potentially for the first time in 20 years. The last time a Republican won both nationally and in the Electoral College was in 2004 when George W. Bush was reelected.
That’s significant because no Republican who has won the popular vote has ever lost the Electoral College in U.S. history. Whereas, it has happened to Democrats five times, 1824, 1876, 1888,
2000 and 2016, although only in 1876 did the candidate, Samuel Tilden, get above 50 percent in the popular vote. All the other times there were pluralities achieved, 40.5 percent by Andrew Jackson in 1824, 48.6 percent by Grover Cleveland in 1888, 48.4 percent by Al Gore in 2000, and 48.2 percent by Hillary Clinton in 2016.
And pluralities in the popular vote are appearing in a number of the multi-candidate polls including the New York Times-Siena poll.
In this case it’s tied, and that usually shapes up for a tight race in the Electoral College.
Election forecaster Nate Silver’s latest model shows that if the popular vote is tied or has Harris up by less than 1 point, Trump has an 89 percent chance of winning. If Trump were to win the popular vote narrowly, his chances of winning rise to 97.6 percent. That makes tracking the national polls still important as a method of taking the nation’s temperature, even though the official race still comes down to the Electoral College.
One factor that could be playing significantly in 2024, as it did in 2016, is the gender gap, wherein Trump leads men slightly more than Harris leads among women. Trump gets 52 percent of men to Harris’ 39 percent, a 13-point lead, and Harris gets 53 percent of women to Trump’s 41 percent, a 12-point lead. But there’s more women than men, and so the race is tied.
That doesn’t necessarily make 2024 a battle of the sexes per se, as in recent decades demographically, the political parties have tended this way, with Democrats leading among women and Republicans leading among men. Democrats tend to win when they can neutralize Republicans’ advantage among men even slightly, and vice versa for Republicans, or in Trump’s case, by winning the gender gap outright.
On issues, the poll is also very interesting, especially since this one was taken in the immediate aftermath of the debate between Trump and Harris.
On who would handle the economy better, consistently the top issue polled this election cycle with inflation still hurting U.S. households, incomes not keeping up and unemployment up by 1.4 million since Dec. 2022, Trump leads Harris 54 percent to 41 percent, including 60 percent to 34 percent among men and even 49 percent to 47 percent among women.
Trump also leads every single age group on the economy: 56 percent to 42 percent among 65-years-old-and-older, 54 percent to 41 percent among 45-to-64-year-olds, 53 percent to 43 percent among 30-to-44-year-olds and even 46 percent to 43 percent among 18-to-29-year-olds.
On immigration, Trump also leads, this time 54 percent to 42 percent, with Trump leading men and all age groups 30-years-old-and-older, while Harris leads women slightly and among 18-to-29-year-olds.
And on the Ukraine-Russia war, Trump leads 51 percent to 43 percent with his peace plan proposal while Harris wants to keep fighting the war. Here again, Trump leads among men and Harris has a slight lead among women, and Trump leads all age groups 30-years-old-and-older.
The only issues Harris leads on are abortion, 54 percent to 41 percent, and “democracy”, 50 percent to 46 percent.
As for which candidate would bring a major change, Trump leads overwhelmingly, with 49 percent saying major change, 10 percent saying minor change and 38 percent saying more of the same. Whereas, only 25 percent think Harris would bring a major change, 20 percent say minor change and 52 percent saying more of the same.
This definitely shows voters are treating Harris as the incumbent — naturally, she’s the Vice President after all — whereas Trump is selling that major reforms are needed rather successfully, which an opposition candidate absolutely needs to oust an incumbent.
If it’s a change election, that could bode very well for Trump, who has a slight lead among independents in this poll, 46 percent to 44 percent. Also, if the election comes down the economy, immigration and the war in Europe, it could also be favorable for Trump, while if female voters remain locked in on abortion, it tightens things up significantly, where Harris has a major edge.
That’s the current state of the race post-debate, and by all indications it could still be a very close race down the stretch — which might not be good news for the incumbent Harris. As usual, stay tuned. ##
Robert Romano is the Vice President of Public Policy at Americans for Limited Government Foundation. ###
Part IV - Additional Observations and Linked Insights
There is an evidence-based case to be made the the political left holds many, but not all, of the advantages in this election. To better understand the political dynamics, or the more housing specific challenges, see the linked and related reports that follow. ##
Update: This story liked below broke at about the time this article was originally posted.

https://patch.com/florida/lake...
>The Rigged System-Who Rigged the System and How to Fix a Rigged System

> Confidence Plummets in Sept-Conference Board Consumer Confidence Index
> Fannie Mae-Existing Home Sales Near 30-Year Low Despite Lower Rates
> Knight-‘Govt Exists to Promote and Protect Ordinary Happiness in Life’
> Doublespeak Doublethink and Insightful Orwellian Lessons from the Left
> Manufactured Housing Institute & Next Great Affordable Housing Debate?
> American Leviathan-Ned Ryun-CEO of American Majority and Voter Gravity
> Former Famed Tampa Bay Bucs & Colts Coach Tony Dungy to Kamala Harris
> TARK-Drill Down on Tyranny vs. Faith; Freedom and Upcoming Election
> Kamala to Oprah-If Somebody Breaks Into My House They're Getting Shot
> NAR-Existing Home Avg $416700 Aug-2024 Interest Rates Slide-Sales Dip
> Deception & Misdirection-3 Tricks-Paltering, Posturing and Projecting
> Caution! Equity LifeStyle Properties Dweller-Investor-Biz-Legal Alerts
> Herland: ‘Aldous Huxley Interview-Tech, Big Gov, Big Biz=Grave Danger’
> U.S. Health-Dr. Marty Makary–‘Broke Medicine’ Blind Spots-Price We Pay
> 12 Examples of Public Calls for Violence Against Trump-More Ryan Routh

> Lessons of Bernie Madoff-Enron-WorldCom-2008 Housing-Financial Crisis
> Gunman Ryan Wesley Routh Insights from CNN-Daily Signal-Patch and X
> What Pastors, Priests, Religious Leaders and People Must Do - or Else
> “TANSTAAFL”–What Does It Mean and Why Does It Matter to You and Yours?
> HUD Admits Decades of Delay-Finally OK Multi-Family Manufactured Homes
> ‘Mobile Home Values Rising Faster Than Single-Family’ House-Wow Fact$
> Realtor-What Is a Manufactured Home? The Next Step Beyond Mobile Homes
> The Two Groups that Should See New Movie Reagan (2024) with Trailer
> Magyar Szabadság Kör – Cultural-Culinary Experience in Plant City, FL
> Realtor? Journalist? Affordable Manufactured Home Production Jumps
> Orlando RE Agent Smith-Younger Adults Will Need $8500 Monthly for Rent
> Blankley-Goodbye American Dream? Only 10% Polled Can Buy a House; But
> A Brief History of Labor Day and Modern Insights for Employees and Pay
> Waiting for Fed Rate Cut Before Buying a Home? Experts Say Think Twice
> Frank Rolfe-Special Interests ‘Don’t Want to Solve Affordable Housing'
> TARK-‘I’m a Teen and Know the Solution to Affordable Housing Crisis’
> Renting? Rent too High? Odds Are DOJ Suit vs RealPage Matters to You
> New-Certified “Half Price Homes” - Affordable Housing Solution Redux
> Solution: “Would-Be Homebuyers Need 80% More Income Than 4 Years Ago”
L. A. “Tony” Kovach and his family live in a manufactured home on private property in Winter Haven, FL. He is the co-founder of ManufacturedHomeLivingNews.com and
ManufacturedHomeProNews.com, trade publications serving segments of the manufactured home industry. Having worked in several segments of the manufactured home industry for over 3 decades, Kovach is a widely acknowledged and often praised expert on manufactured housing.