Community Corner
If You’re Tracking The Aurora, NOAA Offers Some New Clues About Where Lights Will Dance
Solar wind measurements, which can suddenly color a night sky with vivid colors, are among the forecasting tools NOAA has recently updated.


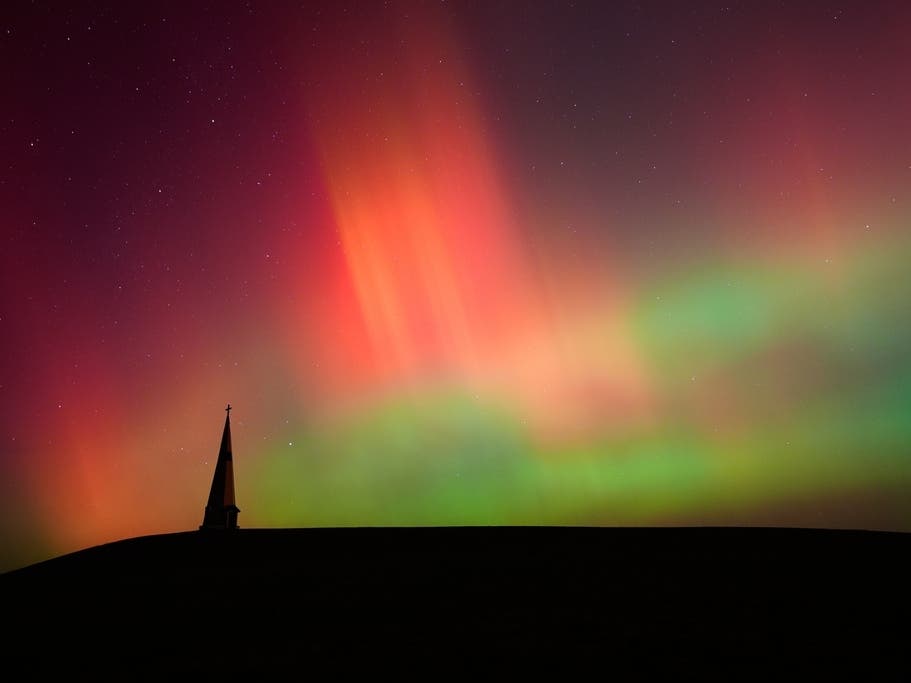
The northern lights are still dancing, most recently tickling the fancies of people as far south as New Mexico as an added surprise during Fourth of July fireworks.
The natural fireworks show caught NOAA’s Space Weather Prediction Center a bit by surprise, too. The agency had issued a G-2 watch, but the storm exceeded expectations due in large part to swift changes in the solar wind that carried the ethereal displays toward Earth.
Now, space weather forecasters have some new tools to track when the northern lights, properly called the aurora borealis, may spill beyond their usual Arctic territory — and how far south they might go.
Find out what's happening in Across Americafor free with the latest updates from Patch.
NOAA updated its solar wind monitoring by transitioning from the DSCOVR spacecraft to a newer vessel, SOLAR-1, positioned near the L1 point about 1 million miles from Earth, with the ACE spacecraft serving as a backup.
This setup offers a limited advance warning of 15 to 60 minutes, as critical details like the solar eruption’s magnetic field orientation can only be measured directly once it reaches L1.
Find out what's happening in Across Americafor free with the latest updates from Patch.
Forecasters rely on measurements like Kp, Bz, and Bt to determine if the aurora will expand southward.
Additionally, NOAA replaced its old real-time display with a flexible viewer that lets users adjust time ranges, zoom, hover over data, and track which spacecraft is providing the feed.
For most people, though, the question is simpler. How likely are they to see the northern lights where they live?
NOAA’s aurora dashboard offers several clues. Here are the seven most useful things to watch.
Tonight And Tomorrow Aurora Maps
Start with the forecast maps with tonight and tomorrow night forecasts.
The colored oval shows where aurora activity is expected. Green generally marks the aurora, while red indicates stronger activity. As geomagnetic conditions intensify, the oval tends to brighten and stretch farther south.
The map is not a guarantee that everyone beneath it will see the northern lights. Clouds, city lights, moonlight and an obstructed northern horizon can wipe out an otherwise good forecast.
Aurora also may be visible outside the brightest part of the oval, especially low on the northern horizon during a stronger storm.
The maps use the highest Kp forecast between 6 p.m. and 6 a.m. central time, so they show the night’s broad potential rather than the exact hour the lights may appear.
One recent change may catch longtime users off guard: NOAA removed the separate “viewline” from the experimental product in May 2026. The maps remain, but the line estimating the southern edge of possible visibility is gone.
What’s The Kp Index?
Kp stands for planetary K index. It measures disturbances in Earth’s magnetic field on a scale from 0 to 9.
For aurora watchers, higher is generally better.
Low Kp values usually keep the lights closer to the polar regions. As Kp rises, the auroral oval often brightens and expands farther south.
A Kp of 3 is relatively quiet. Kp 5 marks the start of geomagnetic storm conditions. Kp 7 is strong activity, and Kp 9 is about as agitated as the scale gets.
Kp is calculated in three-hour periods, so it should not be treated as a minute-by-minute reading. It is best used as a broad measure of how active Earth’s magnetic environment is expected to become.
It also is not a promise. A high Kp can still produce a disappointing view if clouds roll in or the storm peaks during daylight.
What’s A G-Scale?
The G-scale is NOAA’s shorthand for the severity of a geomagnetic storm.
It runs from G1, or minor, to G5, or extreme:
G1: Kp 5
G2: Kp 6
G3: Kp 7
G4: Kp 8
G5: Kp 9
For aurora watchers, a higher G rating generally means the lights may become brighter, more active and visible farther south.
The scale also reflects possible effects on power grids, satellites, radio communications and GPS systems. It was not designed solely to help people decide whether to drive out to a dark country road.
The dashboard also includes R ratings for radio blackouts and S ratings for solar radiation storms. Those matter greatly to aviation, communications and satellite operations, but G is the rating most closely tied to widespread northern lights.
Watch 30-Minute OVATION Forecast
Once darkness arrives, move from the tonight-and-tomorrow map to NOAA’s shorter-term forecast.
The OVATION model — short for Oval Variation, Assessment, Tracking, Intensity and Online Nowcasting — estimates the aurora’s location and intensity for roughly the next 30 minutes.
This is the map to keep refreshing when a geomagnetic storm is underway.
Look for the auroral oval to brighten, widen or push toward your location. The model also shows how activity has changed over the previous 24 hours, which can help indicate whether the storm is building or fading.
Again, the model forecasts activity in the upper atmosphere. It does not know whether your region is covered by clouds or glowing under a parking lot full of floodlights.
Solar Wind Speed Isn’t Everything
The solar wind is a continuous stream of charged particles and magnetic field flowing outward from the sun.
Its speed is measured in kilometers per second.
Faster solar wind can deliver more energy to Earth’s magnetic environment, especially when it arrives with the right magnetic orientation. A sharp increase can signal that a solar disturbance has reached the monitoring spacecraft upstream from Earth.
But speed alone does not determine whether aurora will become widespread.
A fast solar wind with an unfavorable magnetic direction may produce less activity than expected. A somewhat slower stream with a strongly favorable magnetic field can produce more.
Speed is one ingredient, not the finished forecast.
What Are Bz And Bt?
Bz is one of the most important measurements on the dashboard.
It describes the north-south direction of the magnetic field carried by the solar wind. When Bz turns negative, or southward, the solar wind’s magnetic field can connect more efficiently with Earth’s magnetic field.
That allows more energy to enter Earth’s magnetosphere and can increase geomagnetic activity.
For skywatchers, the rule is straightforward: Negative and sustained is better.
A brief dip below zero may not mean much. A strongly negative Bz that lasts can be far more encouraging.
Positive, or northward, Bz tends to limit the transfer of energy. That is why a highly anticipated blast of fast solar wind can arrive without producing the aurora many people expected.
Bt, meanwhile, measures the total strength of the magnetic field carried by the solar wind.
A higher Bt means a stronger field is present, but the direction still matters. A strong Bt paired with a substantially negative Bz is generally more promising than a strong field pointing northward.
The readings are measured in nanoteslas, abbreviated nT.
A simple way to read them:
Higher Bt plus strongly negative Bz: promising.
Fast solar wind plus positive Bz: less promising than it first appears.
Negative Bz that persists: keep watching the Kp forecast and aurora maps.
Solar-Wind Density Matters, Too
Density measures how many particles are packed into the solar wind, usually reported as particles per cubic centimeter.
A sudden jump can signal that a shock or disturbance has reached the spacecraft positioned between Earth and the sun.
That impact can compress Earth’s magnetic field and mark the beginning of a more active period.
Density spikes can be useful early clues, but they do not guarantee a major aurora display. What follows — particularly the direction of Bz — often determines whether the arrival develops into a significant geomagnetic storm.
Why The New Spacecraft Matter
SOLAR-1 and ACE operate near the L1 Lagrange point, a useful location between Earth and the sun where spacecraft can sample the solar wind before it reaches the planet.
That gives forecasters a limited warning window, often measured in tens of minutes, to see what is actually headed toward Earth.
SOLAR-1 now provides NOAA’s primary real-time data. ACE, launched in 1997, remains the backup until another system can provide continuous coverage.
On NOAA’s new solar-wind display, users can select “active” to see whichever source is feeding operational forecasts and computer models at the time.
A Simple Aurora-Checking Routine
Start with the tonight-and-tomorrow map to see whether the auroral oval is approaching your region.
Then check the expected Kp and G-scale. Higher numbers raise the odds of aurora farther south.
After dark, open the 30-minute OVATION forecast and look for the oval to brighten or expand.
Next, check the live solar-wind readings. Elevated speed can help, but the most encouraging combination is a reasonably strong Bt with Bz that has turned negative and stayed there.
Then check the regular weather forecast.
Space weather may be excellent while Earth weather supplies a solid roof of clouds.
Finally, find a dark location with a broad view to the north. Give your eyes time to adjust. A phone camera’s night mode may pick up faint greens, reds or purples before they become obvious to the naked eye.
The dashboard doesn’t promise a show. The solar wind changes quickly, forecasts shift and sometimes the magnetic field points away from Earth. But NOAA says its new tools make it easier to see what’s headed toward Earth, what it is doing when it gets here and whether the night may be worth losing a little sleep over.
Related
Get more local news delivered straight to your inbox. Sign up for free Patch newsletters and alerts.